
Today, every employer expects that you have some advanced knowledge of Microsoft Excel, though it may not be the primary function of your job. Advanced Excel skills can certainly boost your chances of grabbing that vacancy. We have selected the five commonly asked Excel questions in Job interviews:
Microsoft Excel: Interview Questions
1: What is a Vlookup?
Vertical Lookup, or VLOOKUP, is an Excel function that retrieves a specific value from a large dataset organised in a table array. It is a lookup formula which allows you to fetch data based on a criterion.
This Excel function ‘looks up’ from a particular value in the left-hand column of a table array and retrieves the corresponding value that is assigned to it from another column of the array.
The vlookup syntax looks like this:
VLOOKUP( lookup_value, table_array, col_index_num, [range_lookup] )
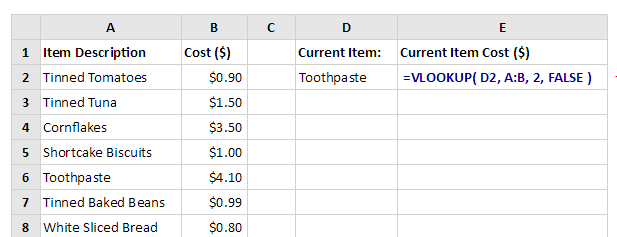
Where these parameters mean:
lookup_value is the cell that you have defined to look up. It is cell D2 in the top image.
table_array is the whole data array or a part of the table. (The table array is A: B)
col_index_num is the column number of the table you want to retrieve the value from; in the above image, that is 2.
[range_lookup] is a function that deciphers the exact value or the nearest approximation, depending on the command. The [range_lookup] can be set to 0 or FALSE for an exact match, or to 1 or TRUE for the closest value.
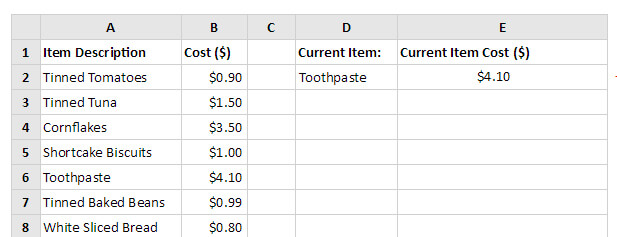
The result:
2: Do you know how to Create Charts?
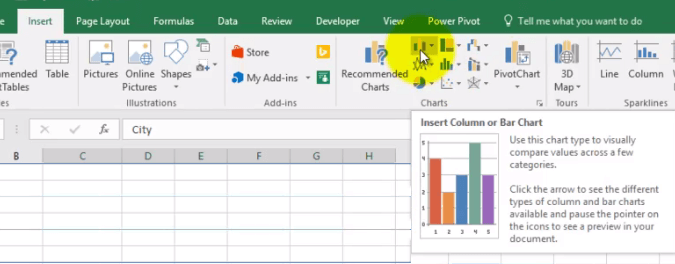
Charts in Excel are of great help for visual reference. Excel has included different types of charts.
The standard charts are Line, Pie, Column, and Bar. There are other representations as well, such as Area, Scatter, Stock, Doughnut, and Surface.
You can find charts by clicking ‘Insert’ and then the Chart button.
If someone asks to find the charts with one click, you have a shortcut for that.
Press F11
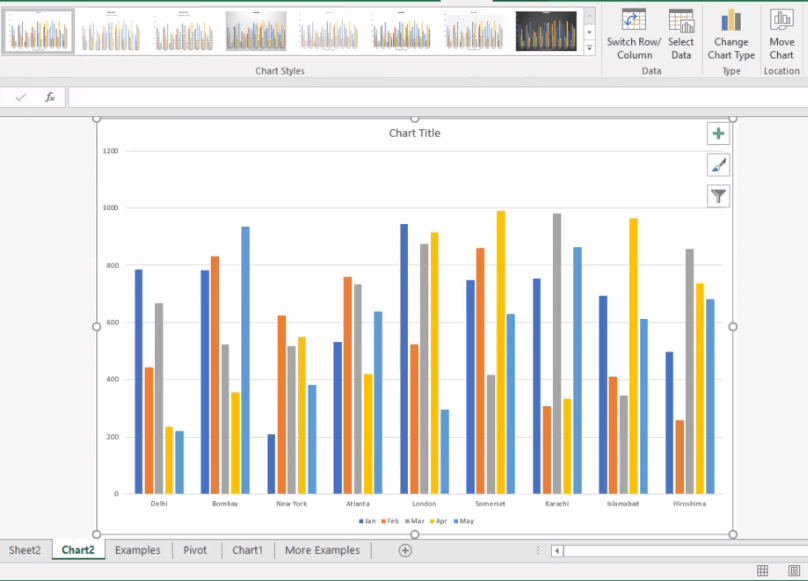
The default chart is the column chart.
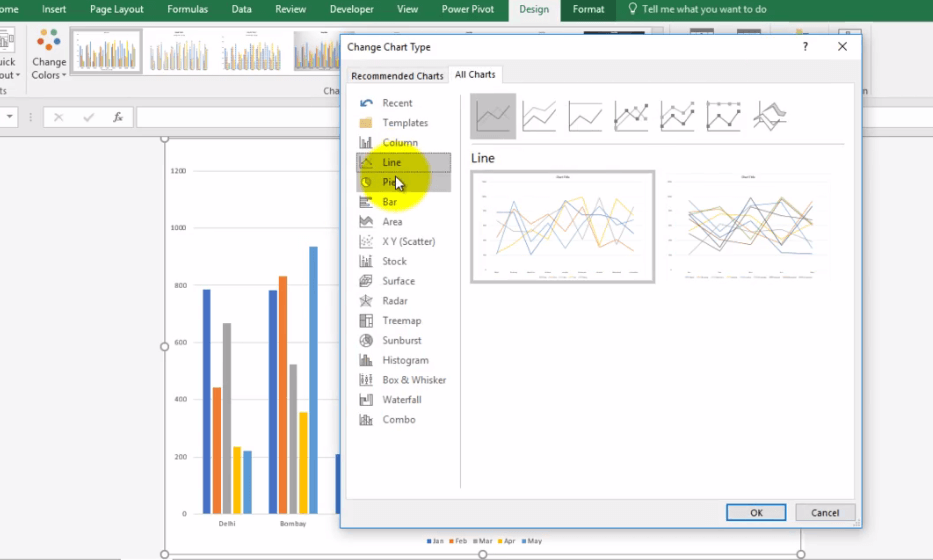
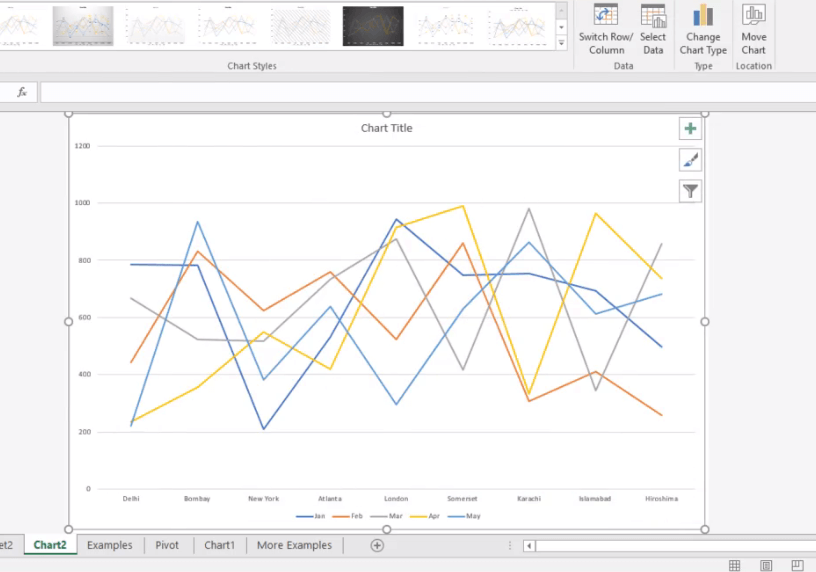
You can choose other charts too. For example: The Line Chart
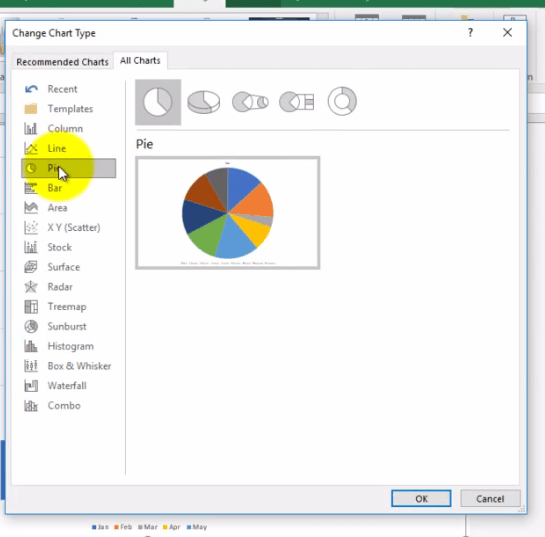
Here is another option – a pie chart.
3: What are Pivot Tables?
A Pivot Table gathers and summarises the data from a detailed spreadsheet or a range of spreadsheets. This table allows you to glance at the information, such as:
Number of items based on each data type;
Sum of a column based on specific data types;
Average of the column based on particular data types.
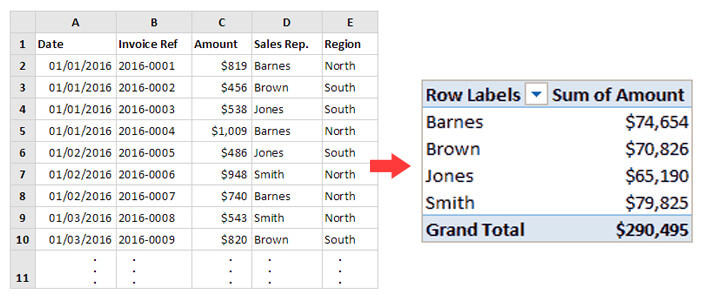
The Excel pivot table also has a feature to extract relevant data from any part of the summarised table.
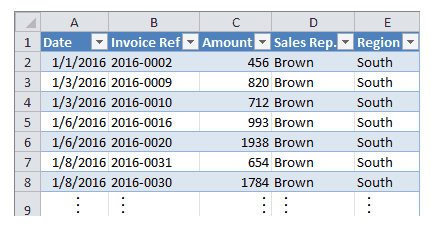
If you click on sales representative- Brown’s name, you get his sales details only.
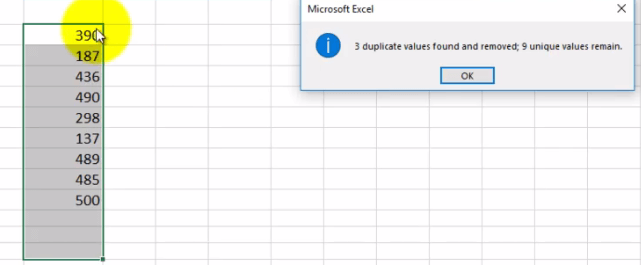
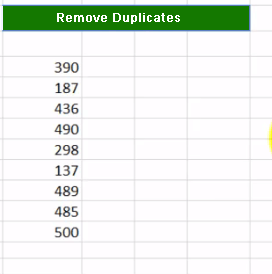
4- Do You Know How to Remove Duplicates?
Removing duplicate cells from the spreadsheet is relatively simple. Surprisingly, many Excel users don’t know this technique and spend hours using Ctrl+F.
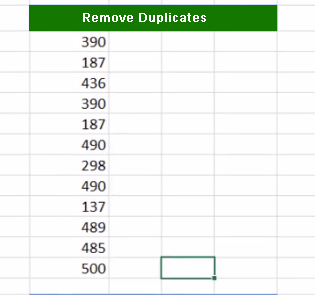
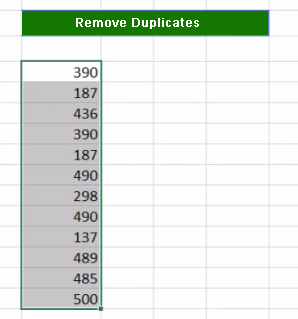
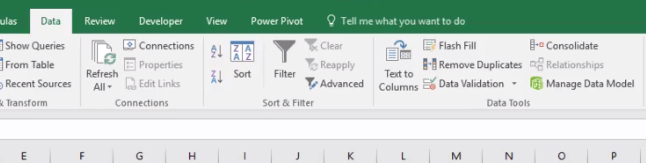
Select the whole column from which you want to remove the duplicates. Go to the ’Data’ tab and click Remove Duplicates.
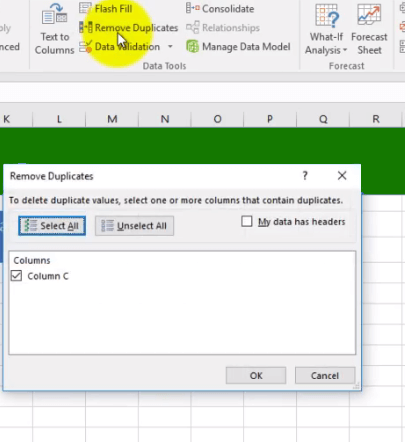
Click OK. The duplicate numbers are removed.
It is a simple step, but many don’t know about it.
5- Do you know the ways of protecting the Books and the Sheets?
Protection is key, and if you don’t know how to protect the files, it will not go down well with the interviewer.
There are three levels of protection in Microsoft Excel:
1- Protecting the complete workbook
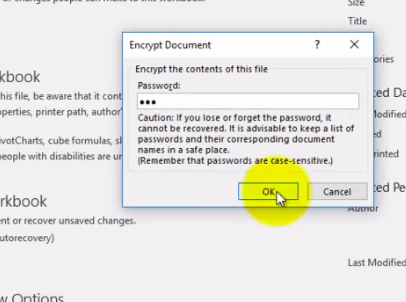
You can protect your entire workbook by putting a password.
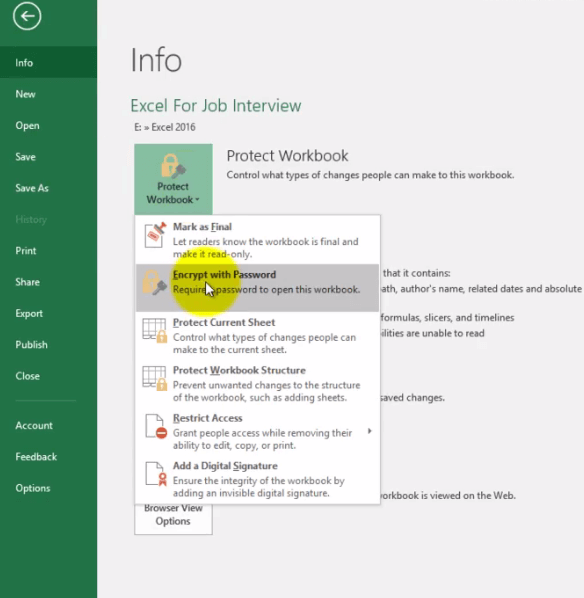
Go to ‘File’ and then ’ Info.’ Choose ‘Encrypt with Password’ and enter a password.
Click Ok, and your book is protected. Nobody can open the file without your password.
2- The spreadsheet:
To protect the spreadsheet in Excel, click the ‘Review’ tab, then click ‘Protect Sheet’.
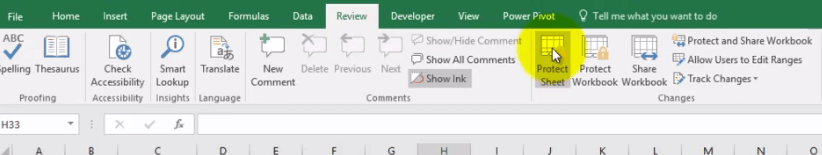
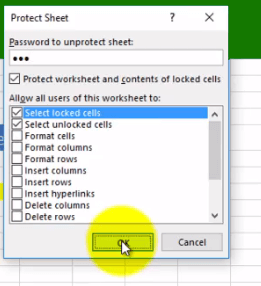
Enter a password and click OK. The spreadsheet is now protected.
3- Locking the sheet and making a few cells editable:
If you want to selectively make cells in a protected spreadsheet editable, select the cells you want to edit. Select the Font down arrow, unlock the cells, and hit OK as shown below:
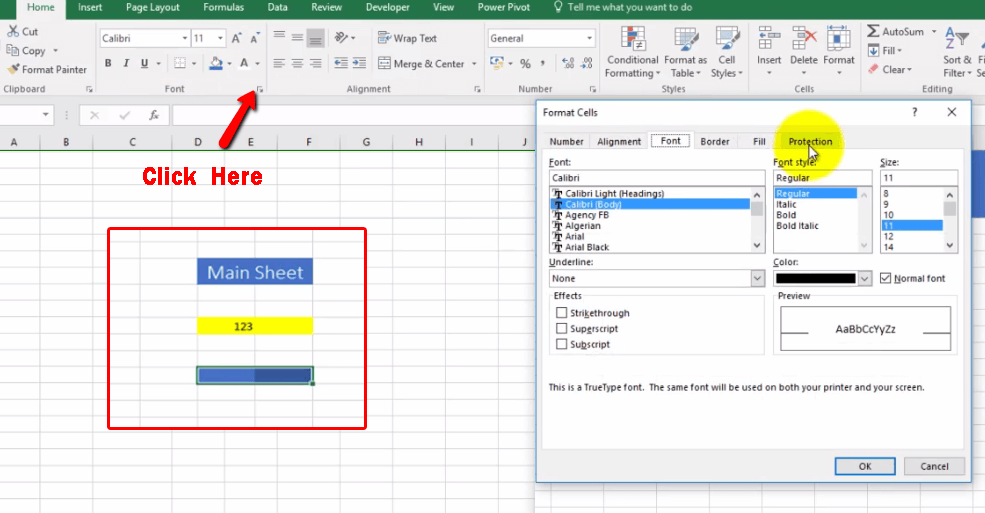
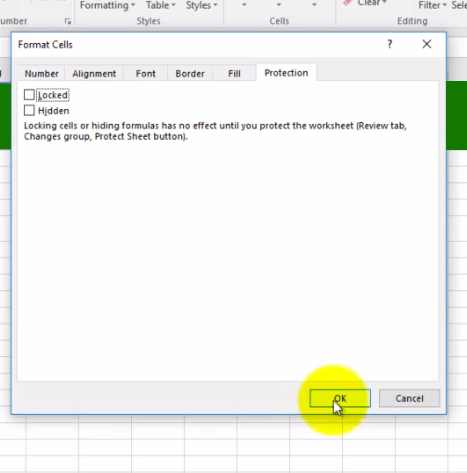
These are the three protection tips used in Excel to protect your files.
Now that you are aware of the commonly asked question, you should do well. There are other topics you should be aware of as well, like Organising Data, Converting rows to Columns, Finding Top and Bottom Performance, Dropdown Lists, and Printing all data on one sheet.
To learn more about Excel, you can check our Excel courses.