
Microsoft Power BI is a comprehensive business intelligence (BI) tool that helps companies turn data into insights that can be used for business decision making. The Power BI ecosystem is a collection of tools and services that provide an end-to-end BI solution. With Power BI, users can connect to multiple data sources, create data models, transform data, produce eye-catching visualisations, and share insights with other teams and organisations.
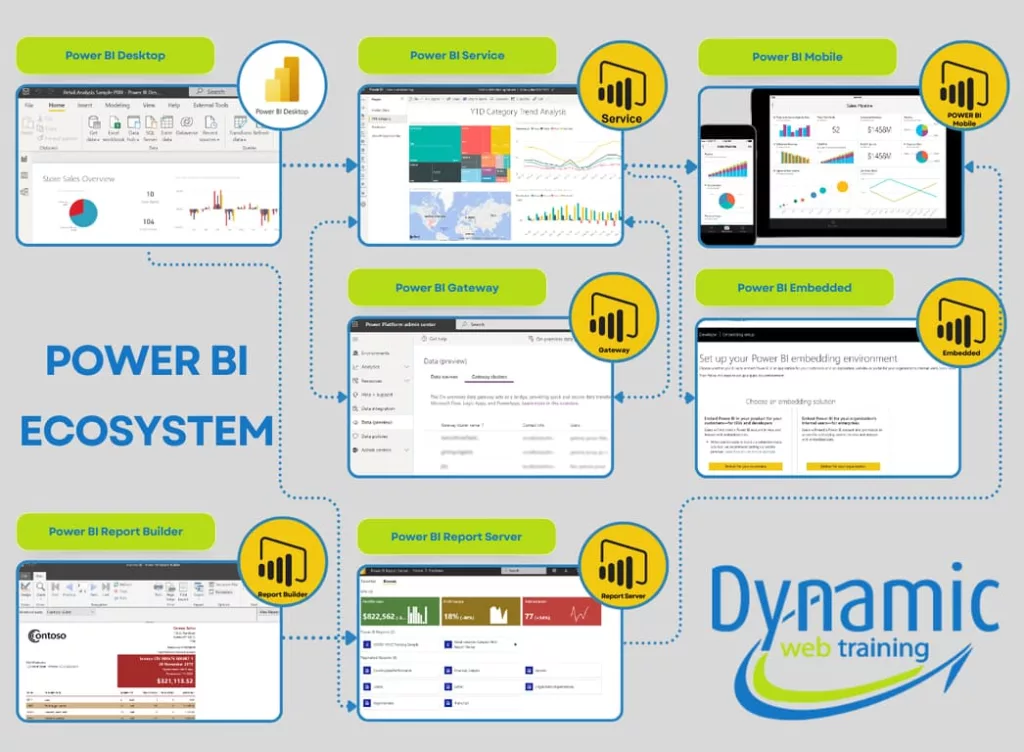
Essential Elements of the Power BI Ecosystem
1. Power BI Desktop
Power BI Desktop is the main tool for combining, transforming, and displaying data.
This enables users to:
- Connect to relational databases, structured datasets, and APIs.
- Perform complicated data processing and transformation, using Power Query.
- Build dynamic data models to make reporting easier.
Best For: Professionals who create reports and dashboards, including data analysts and excel users.
2. Power BI Service
Power BI Service is a cloud-based platform for publishing, sharing, and collaborating on reports.
It enables users to:
- Distribute the reports securely within organizations.
- Collaborate with multiple users in Workspace.
- Deploy tools to preserve data integrity.
Best For: Businesses needing cloud-based, scalable data access.
3. Mobile Power BI
Power BI Mobile gives instant access to dashboards and reports through handheld devices. It provides:
- Quick access to data for fieldwork.
- Report annotation and bookmarking capabilities.
- Push alerts for important business information.
Best For: Executives who need insights on the go.
4. Power BI Gateway
Power BI Gateway allows Cloud-based Power BI services to connect on-premises data sources.
It guarantees:
- Safe synchronization of data between cloud dashboards and local servers.
- Encryption techniques to ensure safe data flow.
Best For: Businesses combining cloud-based and on-premises BI.
5. Power BI Embedded Analytics
Developers can incorporate Power BI reports into various applications with the help of Power BI Embedded Analytics.
Features consist of:
- SDKs and APIs to provide smooth integration.
- Low-code embeddings to improve user experience.
- Personalized customization to align businesses requirements.
Best For: Software companies integrating BI into their applications.
6. Power BI Report Builder & Report Server
Power BI Report Server
- Power BI report server allows on-premises hosting.
- Supports businesses which encourages adherence to laws governing data sovereignty.
Power BI Report Builder
- Produces reports for structured documents, such as financial statements and invoices, that are pixel perfect.
Best For: Classic BI users, compatible with SQL Server Reporting Services (SSRS).
Keeping the Ecosystem Updated
The Power BI ecosystem thrives on its dynamic and iterative workflows, ensuring reports and dashboards reflect the most recent data insights.
The typical workflow involves:
- Data preparation and report creation on Power BI Desktop.
- Deployment to the Power BI Service for cloud-based access and collaboration.
- Real-time sharing of report/dashboard in Power BI Service through secure links and managed workspaces.
- Continuous updates enabled by Power BI Gateway to keep data fidelity.
- Reports and dashboards are accessed on-the-go via Power BI Mobile, which retrieves reports from Power BI Service, ensuring real-time decision-making with the latest available data.
Connectivity of Data in Power BI
Power BI supports both Cloud-based and on-premises data sources
1. On-premises Data Connection
Uses Power BI Gateway to connect On-premises Data sources. Power BI Gateway is compatible with SAP HANA, Oracle, and SQL Server databases. It allows real-time updates & scheduled refresh.
2. Connecting Data in the Cloud
Direct API connection to Google BigQuery, Amazon Redshift, Azure SQL and other cloud services. No gateway is required for real-time data retrieval.
3. Hybrid Data Connection
Use Power Query to merge, transform, and integrate data from both on-premises and cloud sources within Power BI Desktop. It then publishes integrated reports and dashboards to Power BI Service or Power BI Report Server for end-user access.
Building Blocks of Power BI Report
Power BI report is an interactive document that combines several elements:
Visualizations: Graphical representations such as charts, graphs, and other interactive elements that facilitate intuitive data exploration and communication.
Data Sets & Data Models: Datasets provide the structural backbone for reports, linking raw data to actionable insights through robust models. Create connections between datasets using data models.
Slicers and filters: Slicers and filters are used to slice and dice the displayed data. These elements affect the data displayed in the other visuals of the report. They make dynamic data exploration possible.
In conclusion
Power BI ecosystem is a scalable and integrated framework for contemporary business intelligence. Businesses improve collaboration, speed up data processing, and promote well-informed decision-making by using Power BI products like Power BI Desktop, Power BI Service, and Embedded Analytics. To master Power BI skills refer to the range of courses we offer.