
Imagine typing a question like “What were our top-performing products last quarter?” and instantly seeing a chart that answers your question. Power BI’s Q&A feature makes this possible by letting anyone query data in plain English. It’s built into Power BI and uses AI-powered natural language processing to translate your questions into data queries.
In practice, Q&A suggests terms as you type, underlines recognized terms, and flags unknown or ambiguous terms to guide you. Behind the scenes, Power BI breaks down your question, maps words to fields, and builds the query and appropriate visual in a few milliseconds. In short, Power BI Q&A enables non-technical users to explore data by asking questions in their own words.
Setting Up Natural Language in Power BI
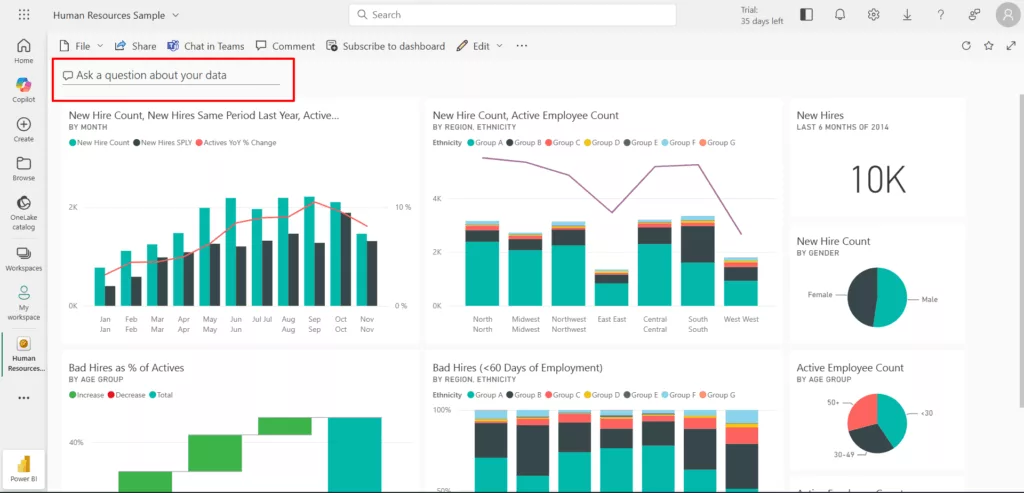
To start using natural language queries, add a Q&A experience to your dashboard or report. Every Power BI dashboard already has a Q&A box in the top-left corner where users can ask questions.
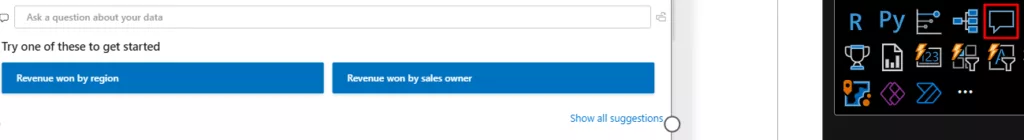
In reports, designers can insert a Q&A visual (a question box) from the visualisations pane. Once added, users click into the Q&A box and type a question; Power BI will automatically suggest questions and auto-complete phrases as they type.
Behind the Q&A visual, Power BI uses your semantic model (the data tables, columns, and measures in your dataset) to interpret the question.
It’s important to optimize your data model so Q&A works well. Follow these best practices:
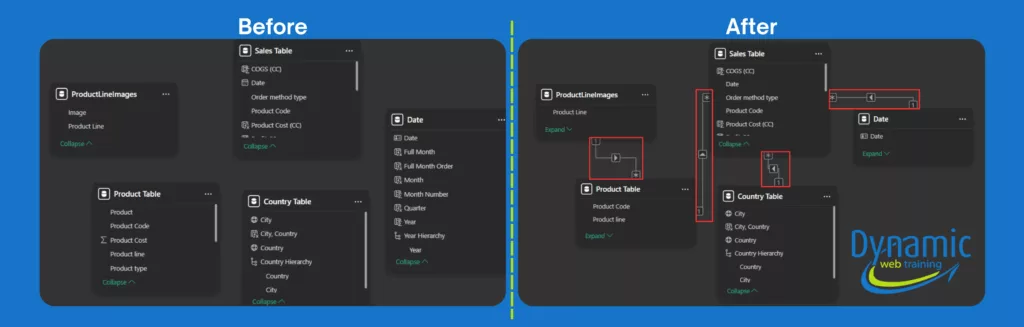
• Clear relationships and structure: Ensure your tables are properly related (e.g., Product linked to Sales) so Q&A can join data. Use a simple star schema where each business entity (customers, products, etc.) has its own table.
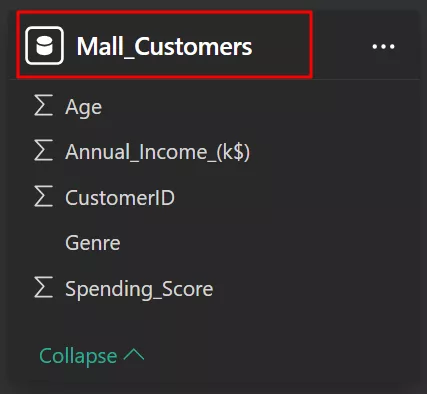
• Friendly naming: Rename tables and columns with business-friendly names (e.g., “Products” instead of “Prod_tbl”) so questions match naturally. For example, a table called Customer_Summary should contain customers, or be renamed accordingly, so Q&A recognizes queries like “customers in Chicago”.
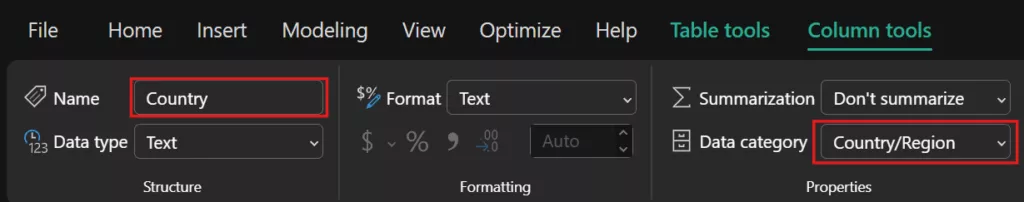
• Data types and categories: Make sure dates and numbers have the correct data types. Mark date fields with a Date or Time category. And for geographic fields such as City, Country/Region, etc set the categories accordingly. Power BI uses this info to choose visuals and to interpret words like “when” vs. “where” in questions. Also set “Don’t summarize” on ID or year fields to avoid odd totals.
• Add measures: Create DAX measures for common calculations like Total Sales so Q&A can use them directly. If you rely on implicit sums, Q&A might produce unexpected results.
• Test and refine questions: Encourage users to try variations. If Q&A underlines a term red, that word wasn’t found in the data; consider adding it to a column or synonym. The orange dotted underline means Q&A isn’t sure, so rephrase or pick the field from the prompt. Users can also append “as a bar chart” or similar to change visuals. Complex analyses may still need a custom measure or report.
• Know Q&A limits: Currently, Q&A answers English queries best (Spanish is in preview) and may not understand very niche jargon unless taught. It’s great for on-the-fly exploration, but it’s good practice to verify its answers before making big decisions. Encourage users to double-check or refine if something looks off.
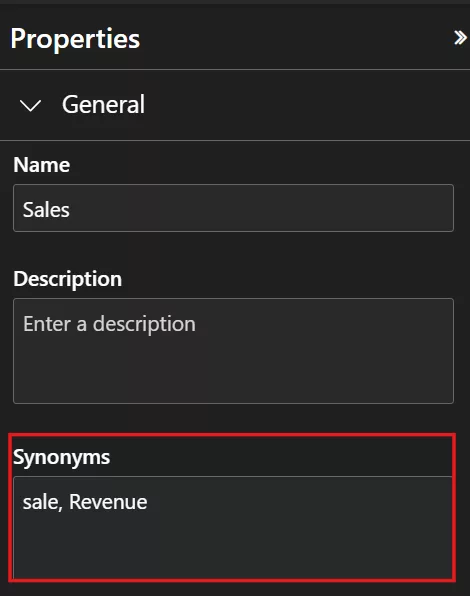
• Synonyms and linguistic modelling: Use the Synonyms feature in Power BI Desktop’s Model view to add alternative terms for tables and fields. For example, if your model has a field named Sales, and if your dataset only tracks product/service sales, go ahead and add “Revenue” as a synonym so Q&A understands both terms.
Pro tip: Use synonyms to simplify the user experience, but never at the cost of accuracy.
Microsoft’s Copilot AI generate synonyms automatically. On a Q&A visual, you’ll see a “Synonyms” pane option prompting you to “Get synonyms” via Copilot.
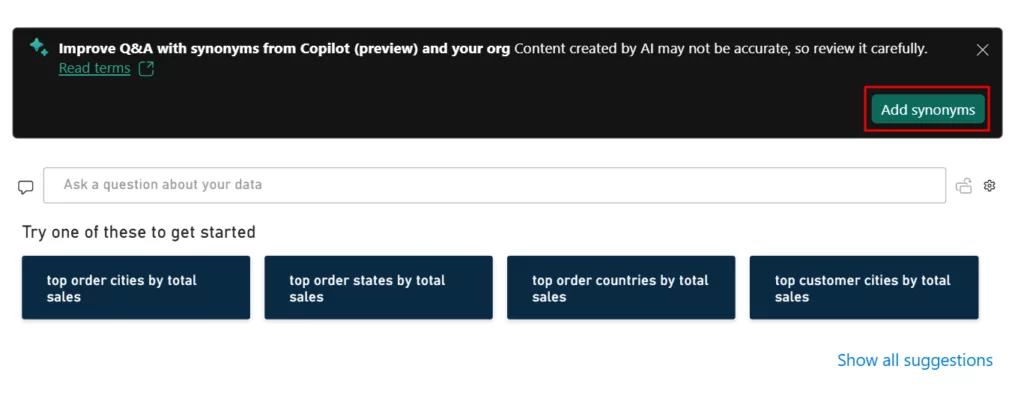
Click the gear icon on a Q&A visual to open the Q&A setup menu.

Here you can review suggested synonyms and approved or remove the terms. Beware: giving the same synonym to multiple fields creates ambiguity.
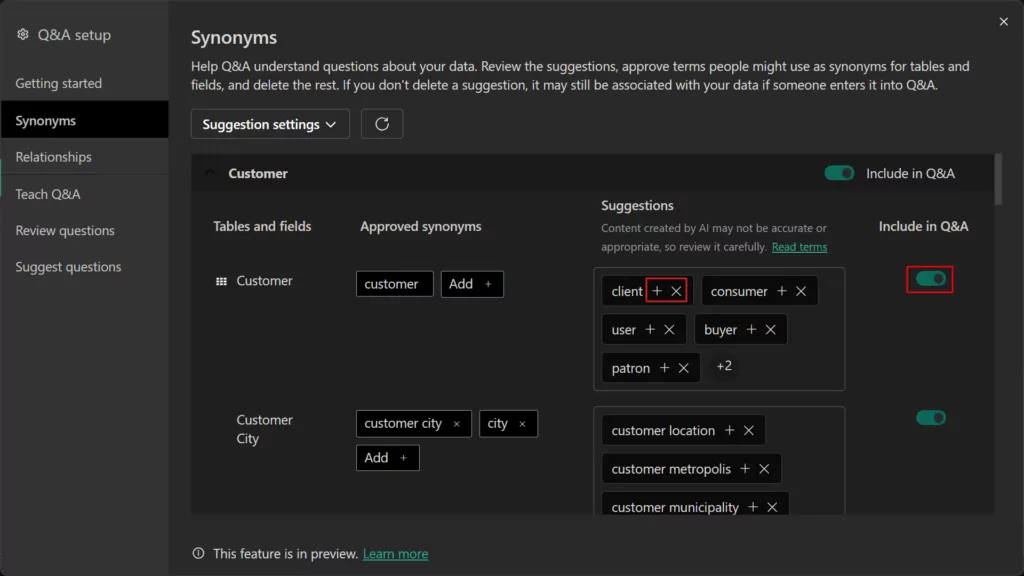
Figure 9: Accept good terms but remove incorrect ones. Hide the columns that aren’t meant for user queries, like internal IDs, from the Q&A visual using the “include in Q&A” toggle.
By preparing the model this way, Q&A can reliably map user phrases to your data fields. For example, one manufacturer added synonyms so that “yield,” “output,” and “throughput” all pointed to the production volume field. The result: operators could ask “factory yield last month” and see the correct chart immediately.
Business Impact and Use Cases
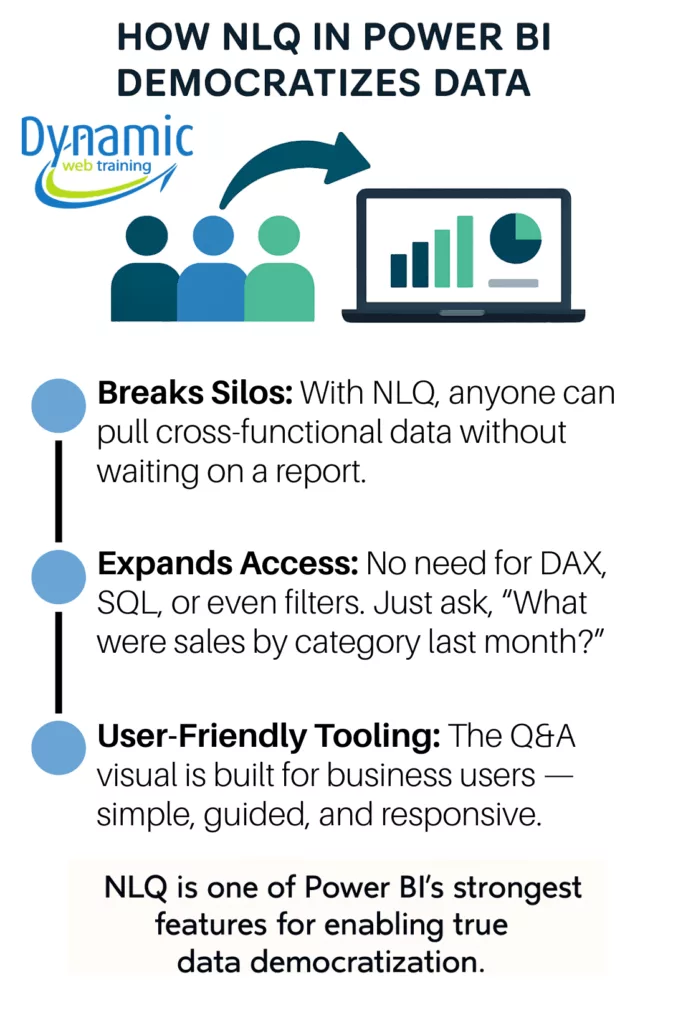
Natural language queries have a clear payoff: they democratize data.
Non-technical users no longer must wait for an analyst or try to remember field names. For instance, a sales manager can type “What were our top-performing products last quarter?” and instantly get a visual answer. A finance user might ask, “Show me expense trends by department” without writing any DAX or filters. This ease of use revolutionizes decision-making.
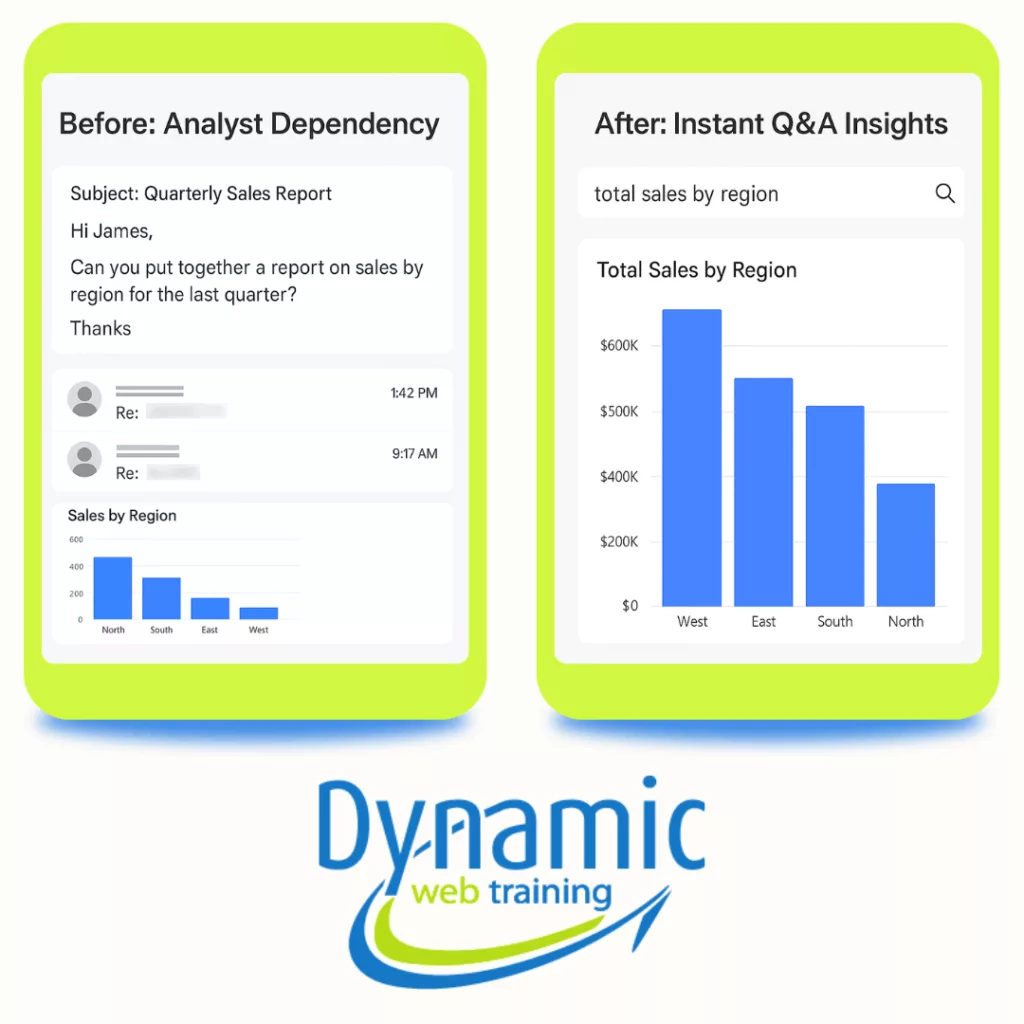
Figure 11: From bottleneck to breakthrough: Manual email-driven reporting vs. instant self-service insights with Power BI Q&A.
Key business benefits include:
Breaking the IT bottleneck: Analysts and BI teams get fewer ad-hoc requests. When managers build their own queries, IT can focus on strategic work. For example, sales teams often stop flooding IT with dashboard requests when they have Q&A.Faster insights: Leaders get answers on demand. One retailer reduced decision-making time from days to hours by allowing store managers to query sales and inventory data directly.Broader data literacy: As people explore data themselves, their data skills grow. Employees see new trends because they ask questions spontaneously. For instance, a manufacturing firm can see an increase in quality improvement ideas after floor operators began using self-service BI tools.Single source of truth: Everyone works from the same data sources and shared queries. When finance and marketing teams look at a Q&A dashboard together, they align on numbers instead of debating who has the right report.
Across industries, Q&A is already in action. Production managers can ask, “What was our downtime trend on Line 3?” to quickly spot equipment issues. Retail marketers can ask “Which products had the highest conversion rate last month?” to fine-tune campaigns. Finance teams usually query “Compare fee income by customer segment” to drive strategy. Because Q&A builds on the existing data model, it automatically respects table relationships and measures you’ve defined. In summary, letting users just “ask a question” in Power BI cuts cycle times, empowers non-analysts, and frees analysts to tackle complex projects.
Conclusion
Natural language queries represent a major shift toward truly self-service BI. Power BI’s Q&A feature is already helping bridge the gap between data and non-technical users. And the trend is accelerating, new AI-powered tools like Copilot for Power BI can even generate entire reports from a plain question. As these capabilities mature, we can expect business users to rely less on formal reports and more on conversational data exploration. If you wish to start developing your Power BI skills, refer to our full range of Power BI courses.