
Copilot in Excel can help you clean data, generate formulas, create visuals and summaries with natural‐language prompts. For each task, type a clear instruction in Copilot Chat, then apply its suggestions. Below are step-by-step workflows for Excel web with example prompts and expected results: Each example below shows a before/after scenario and a prompt template you can try yourself.
Copilot Chat in Excel web is available only if you sign in with a work or school Microsoft 365 account that has the right licenses. In practice, this means a business or enterprise subscription with Copilot enabled. Consumer (personal/outlook.com) accounts and unpaid accounts do not have Copilot Chat. Read more about the right Copilot Licenses here Microsoft 365 Apps Licenses and Copilot Licenses.
Getting Started
Copilot Chat appears as a pane in Excel. On the Home tab of the ribbon, click the Copilot icon. This launches the conversation interface where you type prompts.
Figure 1: Locate the Copilot icon on the Home tab to start your AI chat.
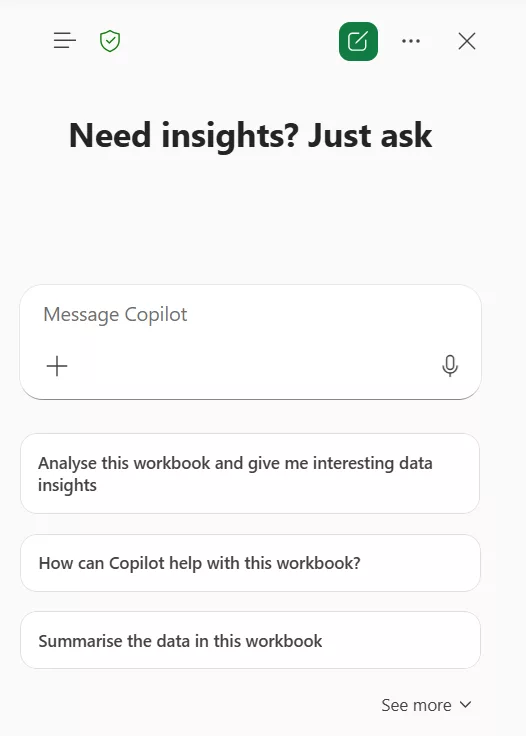
Figure 2: The Copilot pane provides a conversational interface for data tasks.
Merge/Combine Worksheets
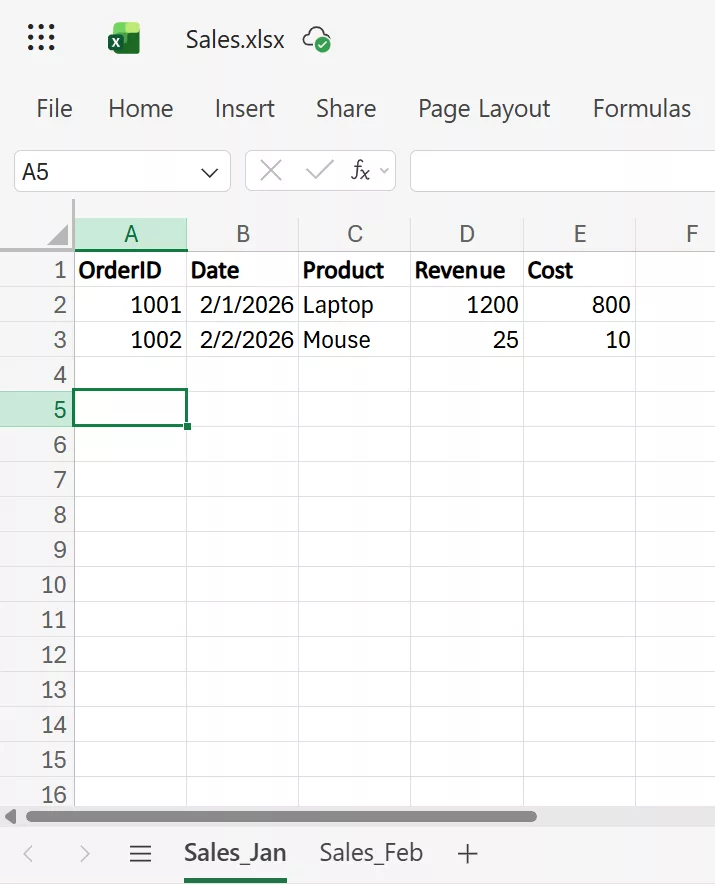
1. Open your workbook where Sales entries for each month are stored in separate worksheets for example Sales_Jan, Sales_Feb and Sales_Mar etc.
2. Open Copilot Chat and type this Prompt: “Merge Sales_Jan and Sales_Feb Insert into a new sheet. Standardize the Date column to YYYY-MM-DD. Remove duplicate rows based on the OrderID column.” If Copilot does not automatically create a new sheet, simply click on “Insert into a new sheet”.
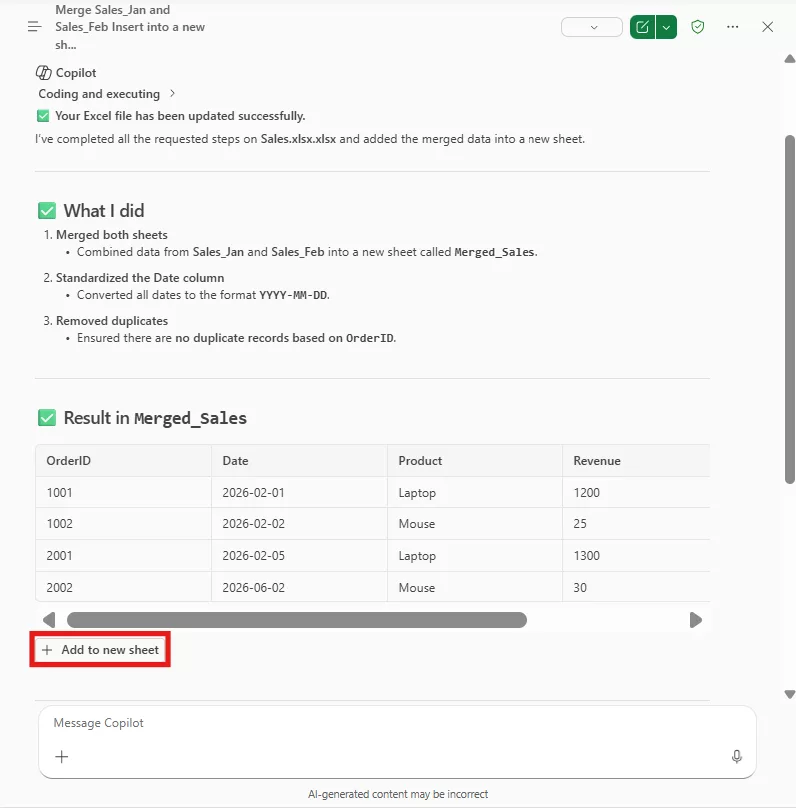
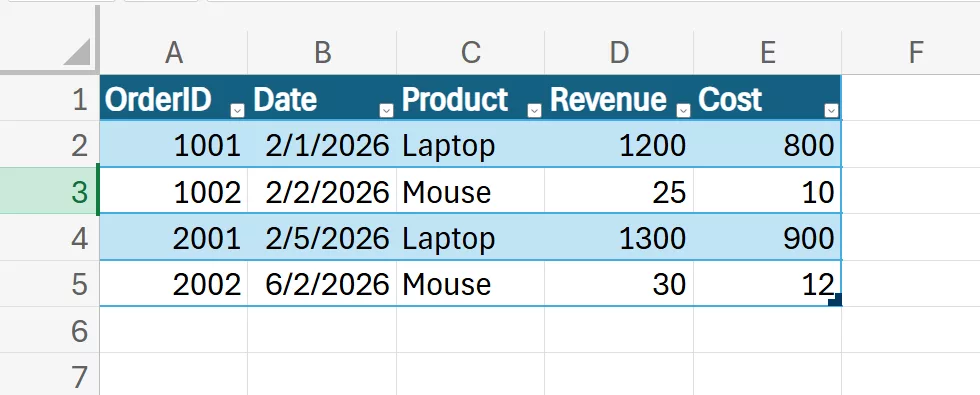
3. After these steps, your merged table should match the preview above.
Clean Data (fix spacing, case, formats)
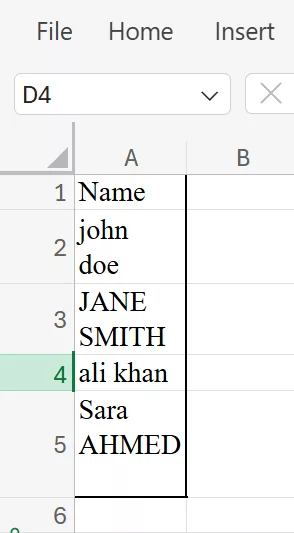
1. Consider a Name column with mixed case or extra spaces:
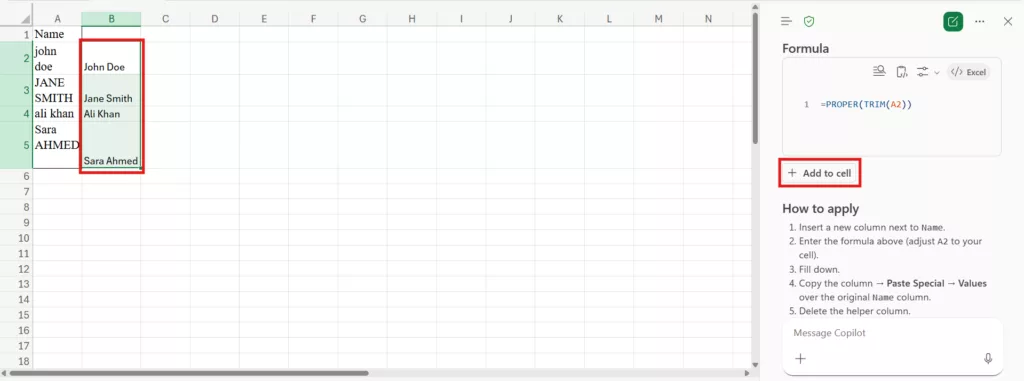
2. Open Copilot and Enter Prompt: “Replace this Name column by capitalizing first letters and trimming spaces.”
3. Click on cell B2 and then click on + Add to cell.
4. Fill down the formula.
5. Copy the column → Paste Special → Values over the original Name column.
6. Delete the helper column.
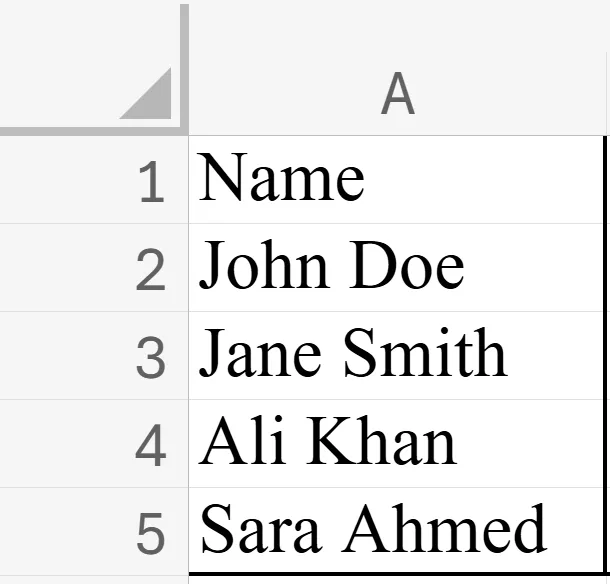
7. Finally, the name column will be free from extra spaces and casing issues.
Formula Generation (add columns/rows)
Copilot can auto-add calculated columns or summary rows.
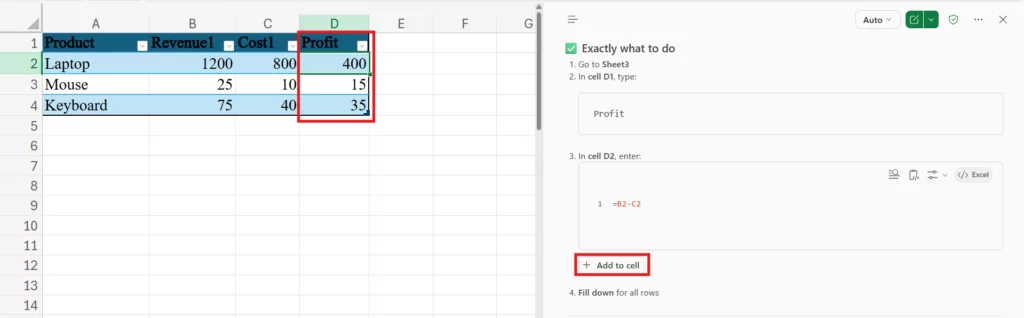
1. For a sales table:
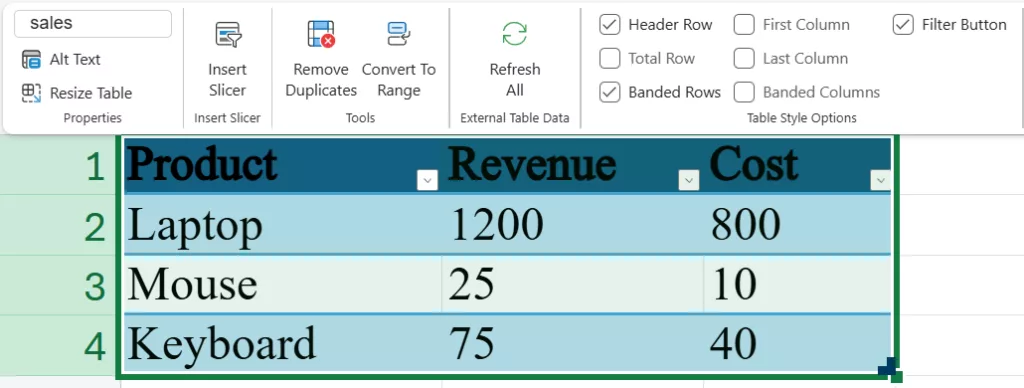
2. Prompt: “Add a Profit column (Revenue minus Cost) in the sales table for each row.”
3. Copilot suggests inserting a =B2−C2 formula; go to cell D1 and click on “Add to cell”, now fill down the values.
Tip: For single-cell calculations, try prompts like “Calculate the percentage increase from cell A1 to cell B1”. Copilot will generate the appropriate formula (e.g. = (B1–A1)/A1) without manual typing.
Pivot Tables
1. Turning raw data into a pivot summary is easy with Copilot. For example, with campaign budgets:
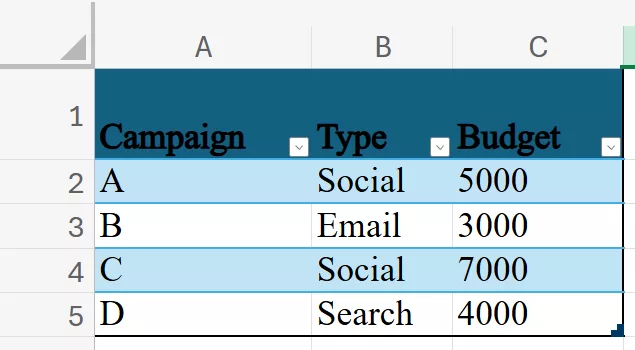
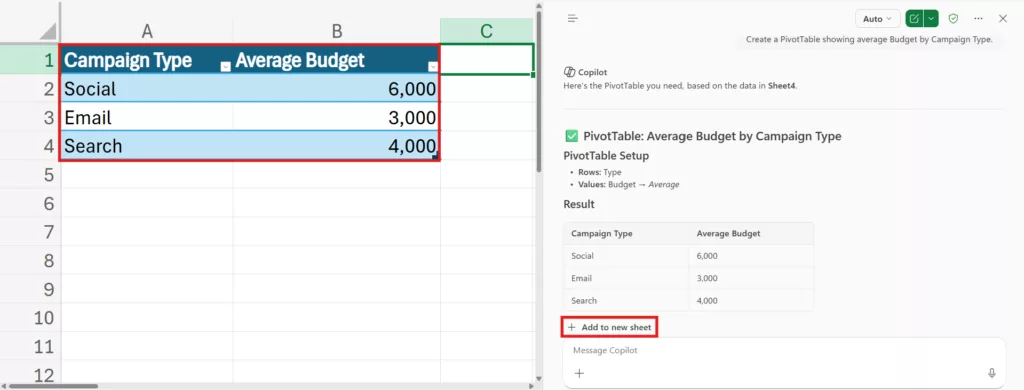
2. Open the copilot chat and type the Prompt: “Create a PivotTable showing average Budget by Campaign Type.”
3. After Copilot: You get a pivot table: Type: Social, Email, Search with Avg Budget per type.
👉 Sample prompt from Microsoft for Sales Data: “PivotTable with sum of sales with Month in rows and Category in columns.”
Charts
The copilot can insert charts with one simple prompt.
1. For quarterly revenue:
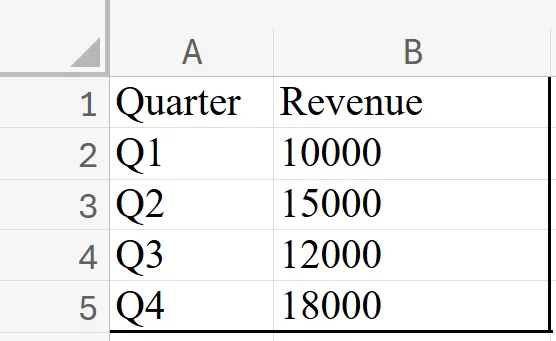
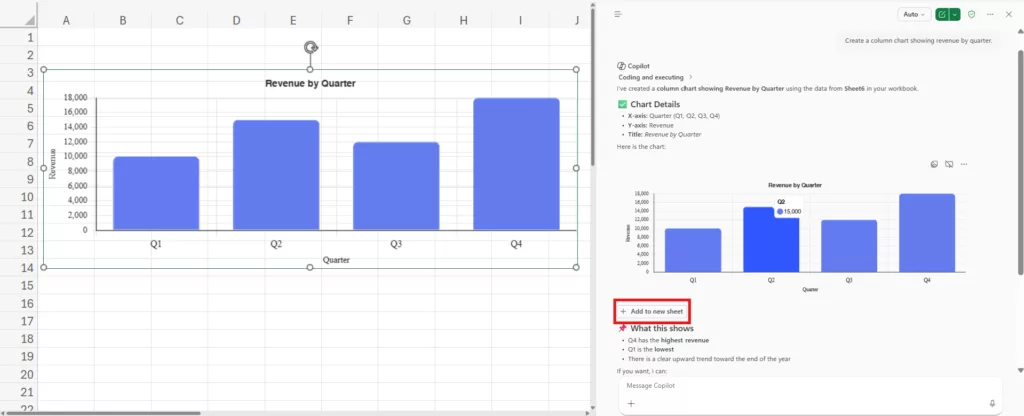
2. Enter this Prompt in the copilot chat: “Create a column chart showing revenue by quarter.”
3. Outcome: Copilot generates an interactive column chart “Revenue by Quarter”.
Filter
You can get Copilot to format or filter rows to spot anomalies.
1. Given sales data:
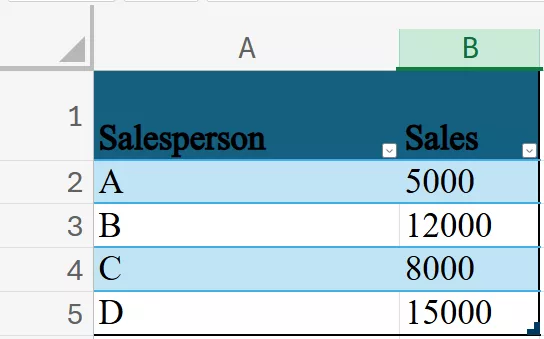
2. Enter Prompt: “Filter to show only orders over 10000 in Sales.”
3. Result: Copilot will generate the table filtered to only display rows where Sales > 10000.
Exploratory Q&A
Copilot can quickly answer questions about your data, even summarizing text.
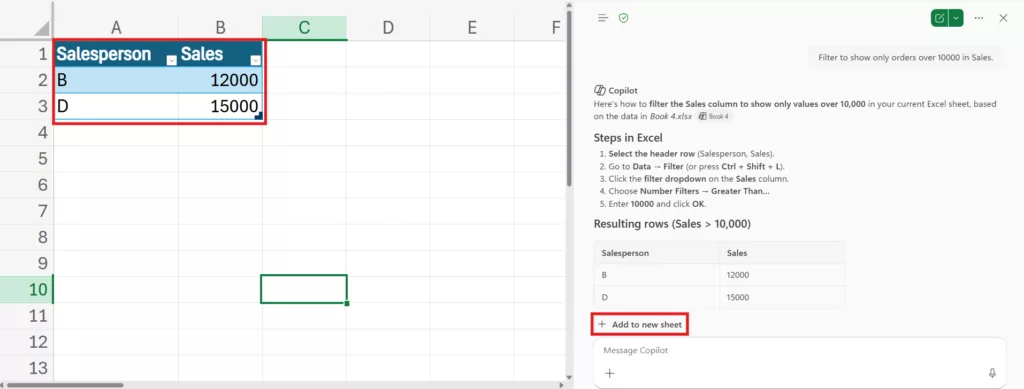
For numeric analysis:
1. Open copilot chat and enter the Prompt: “How many customers are from Europe?”
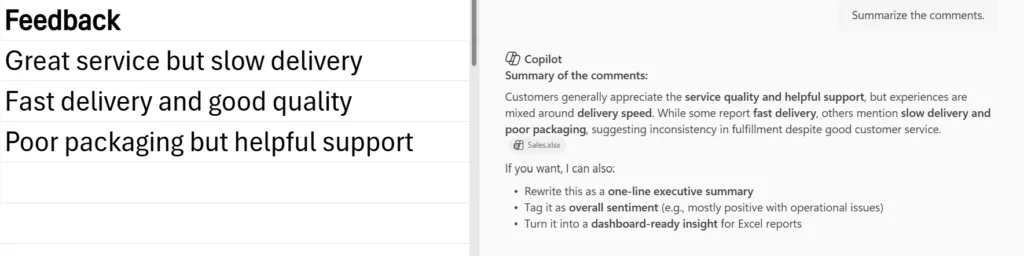
For text-based data (e.g. survey comments):
2. Enter the Prompt: “Summarize the comments.”
Each workflow above shows how Copilot in Excel for the web can streamline common analyst tasks with plain‐language prompts. Remember to verify its outputs, but once you get the hang of it, you can turn manual steps into quick Chat commands.
Recommended Training Path (Copilot Course)
A structured training path helps analysts adopt Copilot in stages. Our Copilot Course is designed with a learning progression that speeds up the data operations and harnesses the capabilities of Copilot while staying aware of its latest updates.
Security, Privacy & Permissions Guidance
Copilot in Excel inherits Microsoft 365’s robust compliance framework. According to Microsoft, Copilot uses Azure OpenAI (not public ChatGPT) and does not train on or cache your data. All content and activity are encrypted in transit and at rest. Critically, Copilot respects existing Microsoft 365 permissions: it will only show data the user has access to, and its semantic index honours role-based access controls.
Best Practices for using Microsoft 365 Copilot
- Ensure workbooks use AutoSave (on OneDrive/SharePoint) because Copilot requires it.
- The copilot’s answers are as trustworthy as the data fed to it. If data is controlled by permissions, Copilot will not reveal outside data. But if someone inadvertently includes restricted data in a query, it could be exposed.
- Analysts can use Copilot for data tasks within Microsoft’s secure framework but should coordinate with their security team.
Conclusion
Copilot in Excel extends the power of generative AI to everyday data analysis tasks for data analysts, BI professionals, and power users. It supports importing data (from web, internal files, emails, etc.), cleaning and formatting, generating formulas (columns, single-cell, lookups), summarizing data (PivotTables, charts, Python), and highlighting/sorting/filtering data, essentially accelerating the full analysis workflow.
FAQs
Click the Copilot icon on the Home ribbon in Excel. That opens the chat pane, where you can ask your queries from Copilot.
Microsoft says Copilot Chat in Excel is available for work or school accounts with a qualifying Microsoft 365 business subscription. Access depends on what your account is licensed for, so availability is tied to your Microsoft 365 setup.