
You’re working on your first major Power BI report. The data is clean, the model is solid, and you’ve carefully assembled charts and tables to bring the story to life. Everything seems to be falling into place. But then comes a perfectly reasonable request from a stakeholder:
“Can we show a mini timeline inside this table?”
“Is it possible to add a visual indicator for each row’s status?”
“Can this KPI card show more than just one number?”
You explore every formatting pane, dig through conditional formatting, and tweak every toggle. But the answer becomes clear: The core visuals have reached their limit.
This kind of roadblock is not unusual. In fact, it’s a moment many Power BI developers encounter early in their journey and this is where the broader Power BI ecosystem of custom visuals, creative workarounds and advanced techniques comes in that can unlock entirely new possibilities.
We’ll walk through the landscape of custom visuals, from certified AppSource extensions to SVG-based DAX tricks and fully custom Vega-Lite visuals built in Deneb. This blog is designed to guide you through those choices. You’ll learn not just what’s possible—but also when each approach is worth considering. But by the end of this article, you’ll have a clearer understanding of the visual tools available to you, and the confidence to go beyond the basics when the situation calls for it.
1. Getting Crafty with Native Visuals (The “MacGyver” Approach)
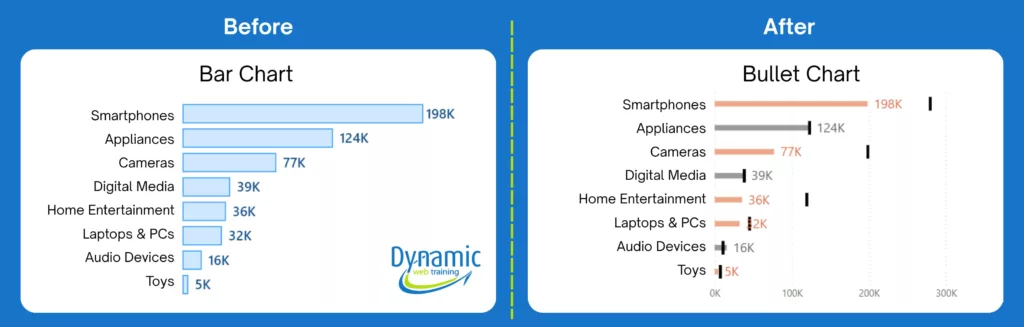
Sometimes the quickest fix is to improvise with what you already have. Fans of old TV shows might recall MacGyver, a hero famous for solving problems with everyday objects. In Power BI, we have an equivalent mindset: using the built-in visuals in clever, unintended ways to achieve a new result. This is fondly called the “MacGyver” approach. Essentially, you take a standard visual and push its formatting options beyond their usual purpose to create something new. For example, did you know you can turn a regular bar chart into a bullet chart by using error bars creatively? Likewise, one example is adding colored bands or KPI icons to a line chart by overlaying objects and using conditional formatting. These tricks are ingenious ways to wring more functionality from native visuals.
When does this help? Imagine you just need a slight tweak: maybe a special indicator on a chart, a custom shape, or an enhanced data label. If a bit of formatting hackery can get you there, it’s often the simplest and fastest solution. You’re not introducing any new components – you’re just configuring existing visuals in an unconventional way. There’s no need for admin approval or external downloads, since you’re still in native territory. And for beginners, it feels more approachable to tweak a familiar visual than to jump into code or new tools.
Trade-offs: The MacGyver approach is usually the path of least resistance, but it has limits. Because you’re bending standard visuals in ways they weren’t originally intended, you might hit constraints on how far you can take it. For instance, not every chart type can be morphed into any shape you imagine – you’re still bounded by the options in the Power BI format pane. Also, a heavily “MacGyvered” visual can become a bit fragile. The more layers and tricks you pile on, the harder it may be to maintain or adjust later. Think of it as a quick fix with duct tape: effective, but if something changes (like your data or a Power BI update altering a feature), your hack might need reworking. Still, for many small needs, this approach strikes a great balance: no extra tools, just creativity. It teaches you to really learn the ins and outs of Power BI’s native visuals, and you might be surprised how often a clever combination of settings can achieve something that initially seemed “impossible” with default charts.
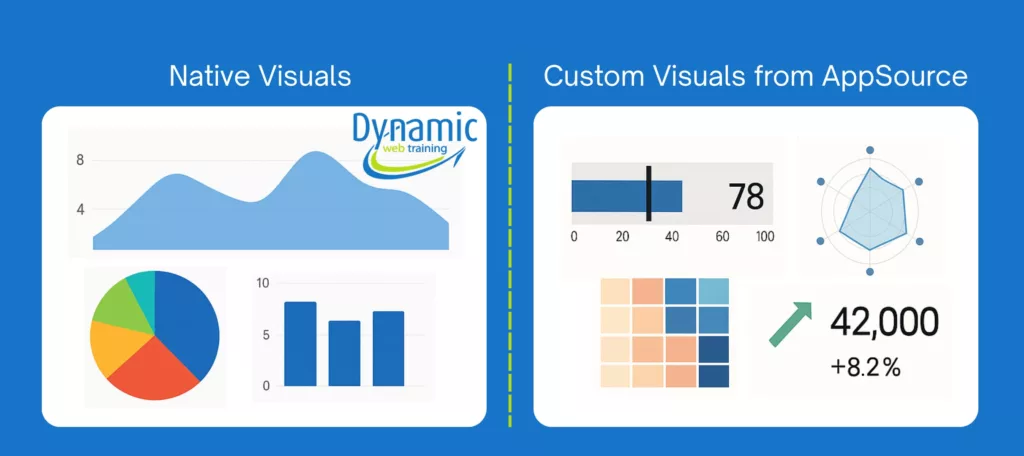
2. Shopping for a Solution: Custom Visuals from AppSource
Sometimes, instead of reinventing the wheel yourself, you can grab a ready-made solution off the shelf. Enter AppSource visuals – essentially Power BI’s marketplace of custom visuals created by Microsoft, third-party vendors, and community developers. Think of it like an app store for Power BI charts: if the built-in visuals don’t have what you need, someone might have built that exact chart type or widget and published it for others to use. For example, if you need a fancy Gantt chart for project timelines or an interactive infographic-style visual, you can likely find one in AppSource with a quick search. These visuals can be downloaded directly within Power BI Desktop and inserted into your report.
Pros: The obvious advantage is speed and specialization. You benefit from someone else’s development efforts – often experts who built a visual for a specific purpose. Many custom visuals fill important gaps where the base product is not yet where it needs to be. Some visuals are open-source and free; others might require a paid license for full functionality. Notably, paid visuals often come with support from the vendor (you can reach out if something goes wrong), whereas free ones are typically “as-is” with no guaranteed support.
Cons and considerations: First, governance and security. Using an AppSource visual isn’t just a personal choice; your organization might have rules about it. Many companies only allow certified visuals – those with a blue check mark in the marketplace – because certified visuals are vetted to ensure they don’t send data outside Power BI and meet certain security standards. If a visual is not certified, it might be blocked or require special approval, especially in strict enterprise environments. Even if allowed, all custom visuals must be enabled by your Power BI administrator before you can use them in reports for your organization. This is akin to IT approving an app before it’s installed on company hardware.
When to use AppSource visuals: Reach for the marketplace when you need a specific type of chart or capability that’s well beyond native visuals. A few realistic examples: organizational chart visuals, advanced maps, heatmaps, word clouds, network graphs, interactive timeline sliders, or the OKVIZ Synoptic Panel for custom shape maps (useful when native visuals fall short for highly customized needs). These are scenarios where building from scratch would be daunting, but someone has already packaged a solution. By all means, leverage it – Power BI’s extensibility is one of its strengths, and Microsoft designed the custom visual ecosystem to let the community extend visualization capabilities.
Just be mindful of the trade-offs: Ensure the visual is trustworthy and well-supported, and stay open to pivoting if it no longer meets your needs. But when it does work, the right custom visual can feel like plugging in a missing puzzle piece—delivering instant functionality with minimal effort.
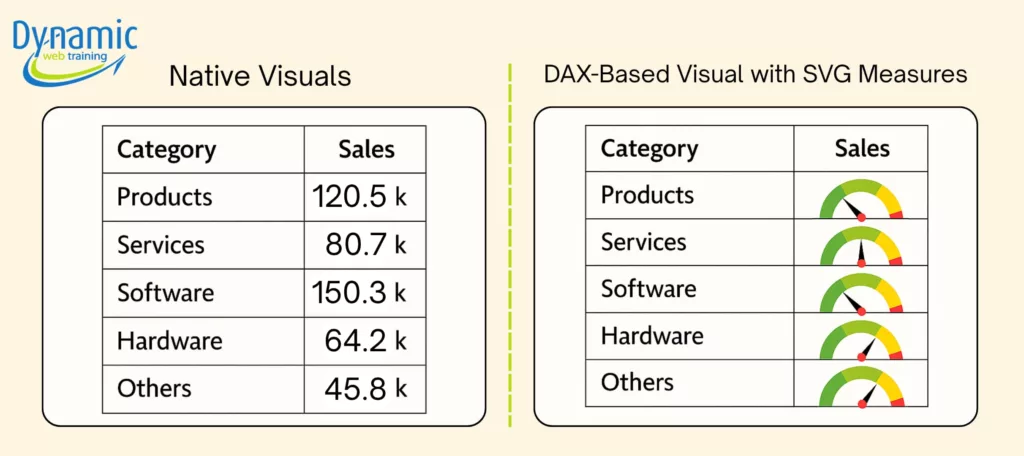
3. Hacking a New Path: DAX-Based Visual Tricks (SVG Measures and More)
Now we get to one of the more mystic corners of Power BI: using DAX, the formula language, to create visuals from scratch. This approach is like programming your own chart using code, but doing it entirely within Power BI’s native engine – no external visual needed. One powerful technique in this category uses SVG (Scalable Vector Graphics). SVG is essentially code (XML) that describes shapes and drawings, which can scale without losing quality. Power BI can actually render SVG images if you output the SVG code as text from a measure or column and tell Power BI it’s an image URL.
In simpler terms, you write a formula that returns an image. Moreover, if you place your SVG measure in a table or matrix that’s filtered by slicers, row‐level categories or page filters. Power BI will automatically reevaluate that DAX per visible row. That’s how you will get dynamic micro‐visuals that always match the current filter context.
Use cases: typically, these DAX-SVG tricks are used for small “micro-visualizations” that augment your data rather than full-blown charts. Imagine a KPI card that instead of just showing a number, also has a little custom gauge or icon that changes color dynamically; with a bit of DAX and SVG, that’s achievable. The most common use cases for DAX-SVG custom visuals are micro trend lines, progress bars and custom icons.
Why not do this all the time? Well, the SVG specifications can become very complex (lots of coordinates and tags), and debugging that inside a DAX measure is not for the average user. The learning curve here involves both advanced DAX skills and at least some understanding of how SVG works. Maintenance can also be challenging: if you, months later, need to adjust that custom SVG, you’ll have to dive back into that tangle of code.
That said, Still, as a beginner, you shouldn’t feel pressured to jump into SVG hacking immediately. Consider this the “advanced toolbox” – it’s good to know it exists for when you really need a bespoke visual inside a standard Power BI table or card.
A Blank Canvas for the Brave: Deneb (Vega-Lite Visuals)
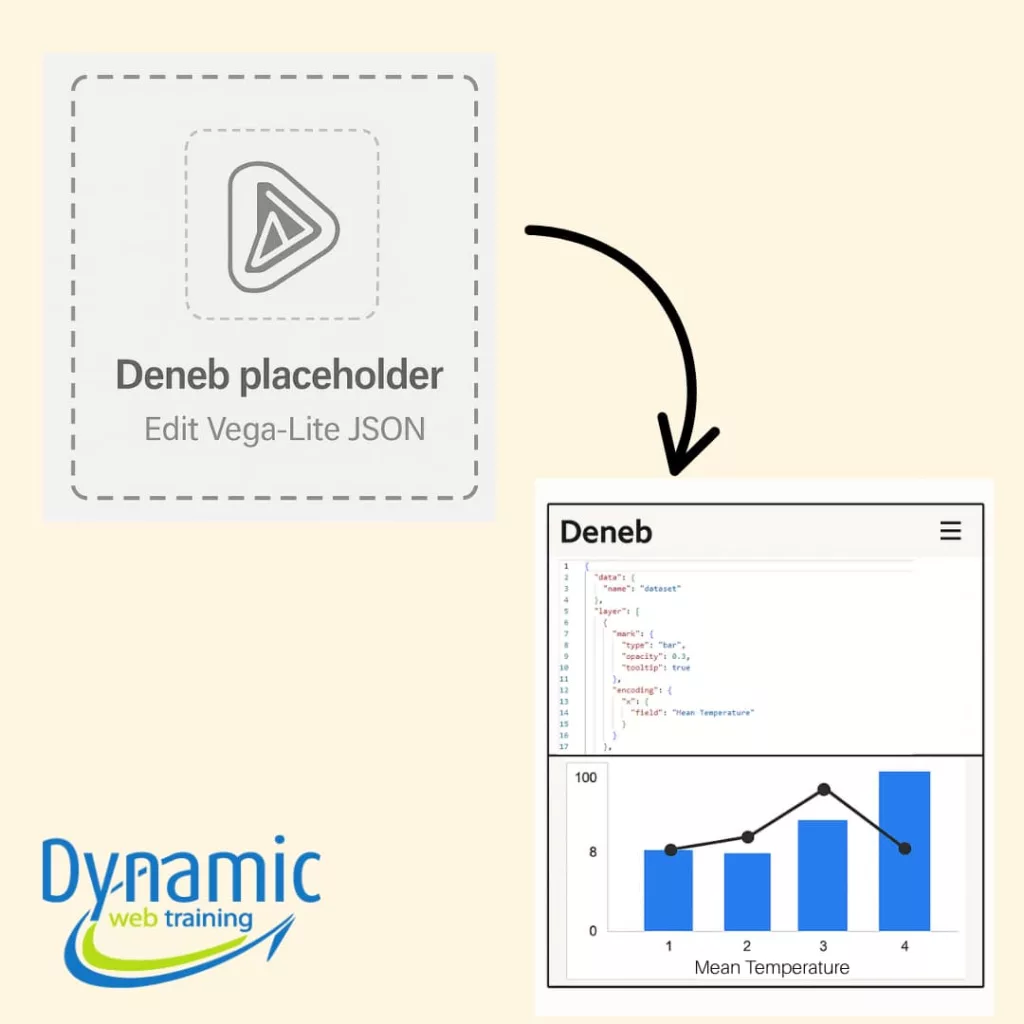
Our final stop on this tour is Deneb, a custom visual that is a bit unique – it’s like a canvas where you can paint your own chart using a special JSON-based language (the Vega or Vega-Lite specifications). Deneb is like writing a detailed blueprint for a chart in a declarative language.
Here’s how it works in concept: You add the Deneb visual (available from AppSource, free and open source) to your report. When you open it, instead of dragging fields and choosing from dropdowns, you edit a JSON text specification that describes your chart – which fields to use, what marks to draw (bars, lines, points, etc.), encoding channels like color or size, axes, titles, and so on. It might sound like writing code, but it’s more like describing the chart in a structured way. The Vega-Lite language it supports is quite powerful; you can layer multiple chart elements, calculate statistics, handle interactions, and make very finely tuned designs that go well beyond Power BI’s native capabilities.
Using Deneb comes with a learning curve and time investment. If you’ve never worked with Vega or JSON specs before, it can feel like learning a new language. Even though Vega-Lite is considered easier than full Vega or raw D3 code, you’ll still need to understand its syntax and logic. Writing, testing, and debugging a visual spec can take more time than just using a built-in visual. It’s recommended more for those who either have a specific visual need that nothing else can fulfill, or for people who enjoy the challenge of learning a new visualization language.
When might Deneb help? You need a niche chart type (like a violin plot or a unit chart or a specific infographic) and you have seen a Vega-Lite example of it – Deneb lets you bring that example right into Power BI by essentially copying or adapting the Vega-Lite spec. It’s empowering in the right hands. For a beginner, Deneb might not be the first thing you jump into, but knowing it’s out there is reassuring: if you can describe it, you can visualize it, given enough skill and patience.
To sum up, Deneb represents the “build your own visualization” philosophy. It’s like getting a model kit where you assemble the pieces exactly how you want, rather than buying a pre-made model. It takes more work, but the result is tailor-made. And just like building your own model, you’ll learn a ton in the process about how visuals are constructed. If that notion excites you more than it scares you, keep Deneb in mind as you advance in your Power BI journey.
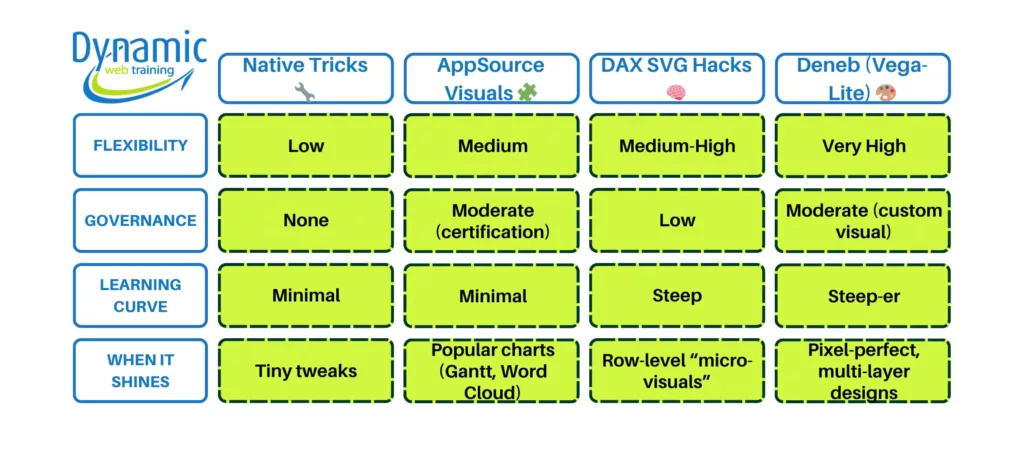
The Opportunity Behind the Obstacle: Power BI’s ecosystem offers four practical escape routes:
In summary, hitting the limits of native visuals can feel like a dead end, but in reality it’s more like a fork in the road. You’ve got multiple paths – from quick hacks to advanced custom builds – to choose from. As a beginner, take comfort that you’re not the first to face these challenges, and a whole community has developed solutions for them. Start with the simple and move to the complex only as needed. Over time, you’ll develop an intuition for which approach fits a given situation. And who knows – someday you might come up with a creative new visual workaround that you’ll share with others! Until then, keep exploring and learning at your own pace. Power BI is both a science and an art, and the more techniques you know exist, the more confident you’ll be that no visualization challenge is truly insurmountable.