
Today, Power BI is widely used in Data Analytics and Business Intelligence & adopted by a lot of companies as a BI tool of choice. The ease of simplifying complex data & sharing it visually is what makes it one of the best. While there are various competitors to Microsoft Power BI, it has many features that make it better than the others. Creating attractive and comprehensive visual dashboards is one of its primary features. Before moving on to creating the first dashboard, let us recall Power BI has basic 3 functions & several features.
Using Microsoft Power BI Dashboard
Basic Functions of Power BI:
- Datasets: In simple words, Dataset is an assimilated data which you can connect or import to Power BI. You can export data from your computer just by selecting the proper extension file. Files like excel, CSV, etc. are compatible with Power BI. So you don’t need to type data again on Power BI. Just import it! This function reduces the amount of work time.
- Dashboards: Dashboards are multipaneled visualization of customized data interface. Every data is connected via smaller displays known as “Tiles”. The dashboard is a result of a linked dataset. These dashboards can be shared with work colleagues or other officials.
- Report: Reports made by Power BI ensure the representation of important data according to its relevance. These Power BI reports can be shared easily on one condition. The condition is, people who want to view this data should have a Power BI account. None of the public email ID’s will work. It is something similar to an Intranet Portal.
The Power BI Dashboard :
In one of our earlier blogs, we have discussed about Power BI dashboard. But, now we are going to discuss the steps to create a dashboard in few minutes.
Steps to Create a Power BI Dashboard Quickly:
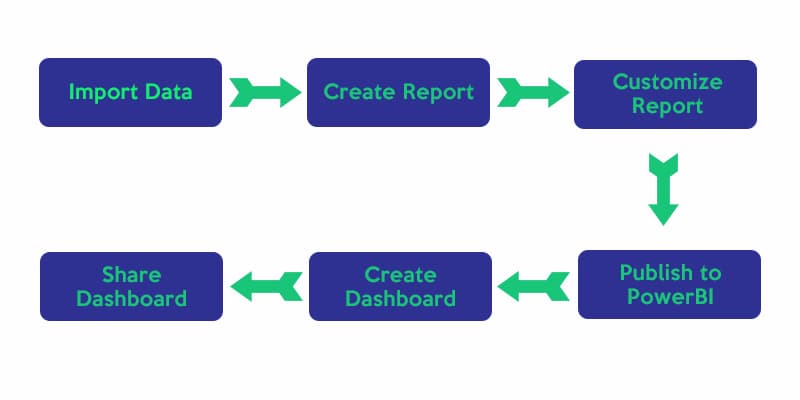
The following chart shows the flow of the dashboard creation process which we will discuss here.
1) Import dataset & a report:
Firstly, we need to import data from our PC. Data can be in MS Excel, SQL Server, Analysis services, CSV, Web, OData Feed or Blank query format. Once the dataset is loaded, Power BI will also create a report for your workplace. Report gets created automatically from the PowerView sheets.
For importing data you need to follow below steps:
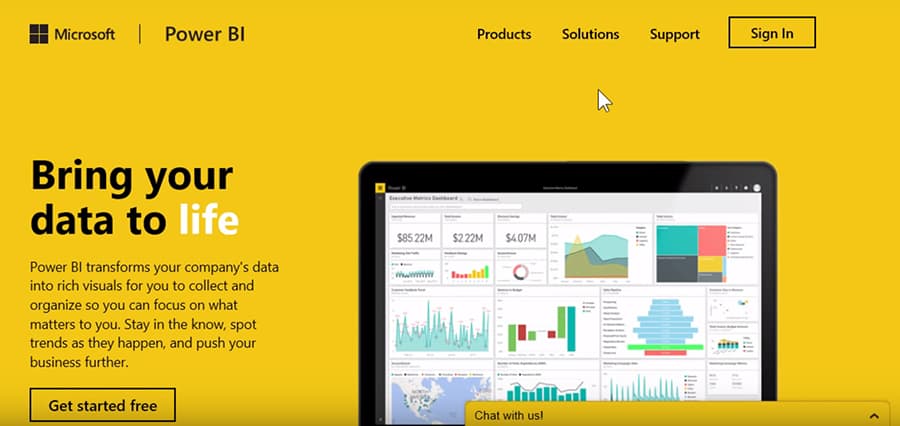
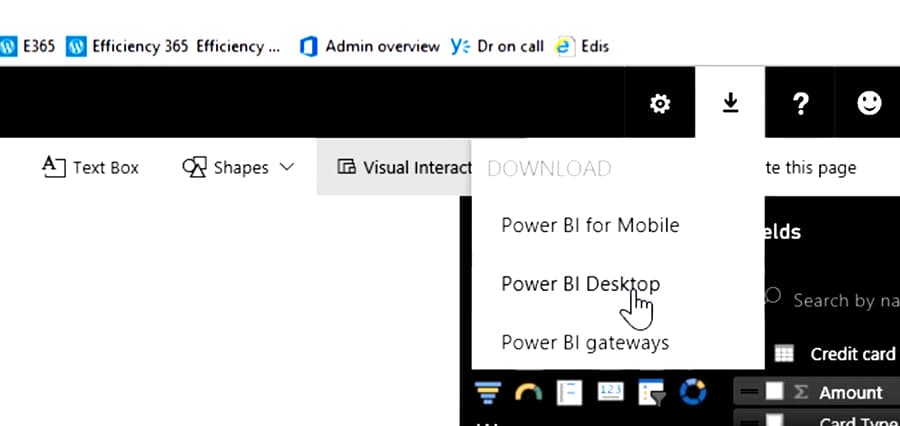
- Open Power BI Desktop. ( it is free to sign in, if you don’t have an account)
- Look for “Get Data”, it is on the left upper panel.
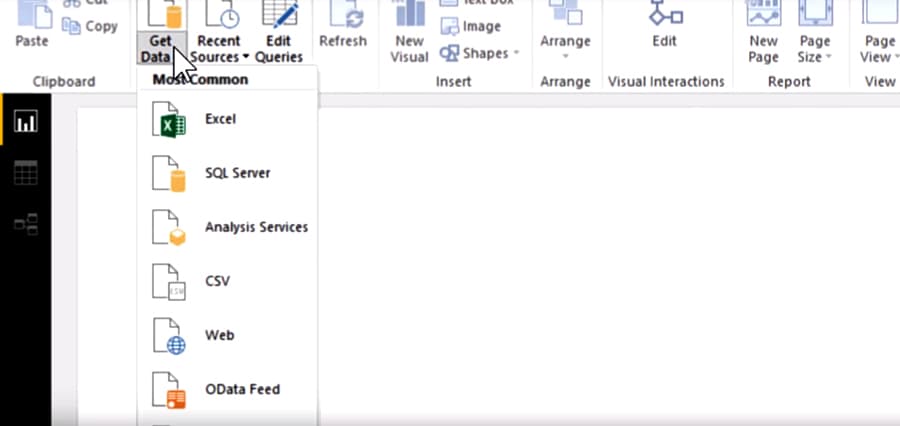
- You will find five or more types of files. Select format according to the data you want to import
- Now, Navigator will open, locate your file & Load it
- Loading may take some amount of time if the data is big.
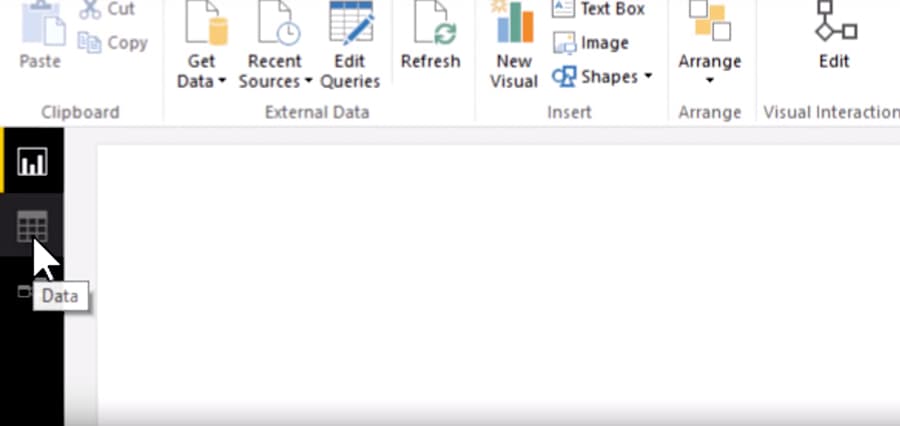
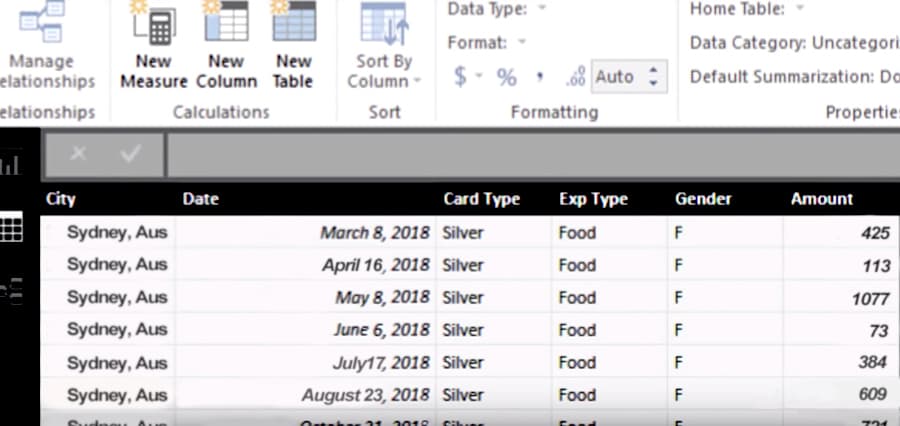
2) Understanding left bar options:
There are 3 options on left bar: Report, Data & Relationships. While you load a file, you may see nothing in the Report section. However, you can view your data by clicking on Data option.
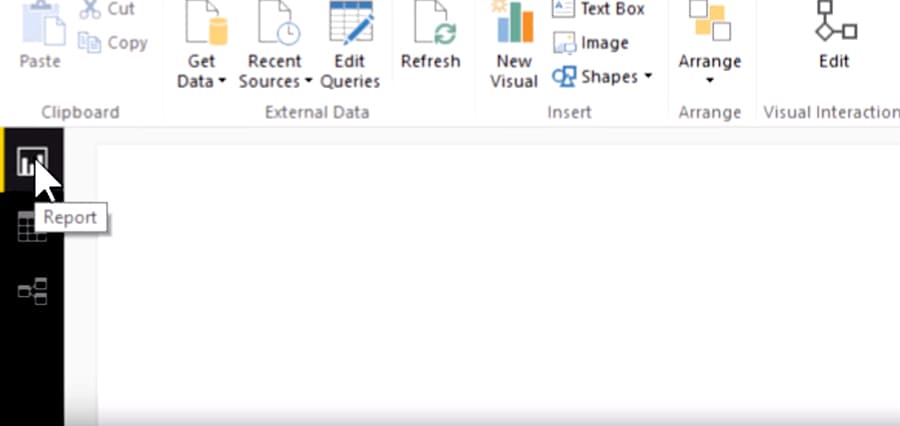
(Relationship option is useful if you are having more than 1 table.)
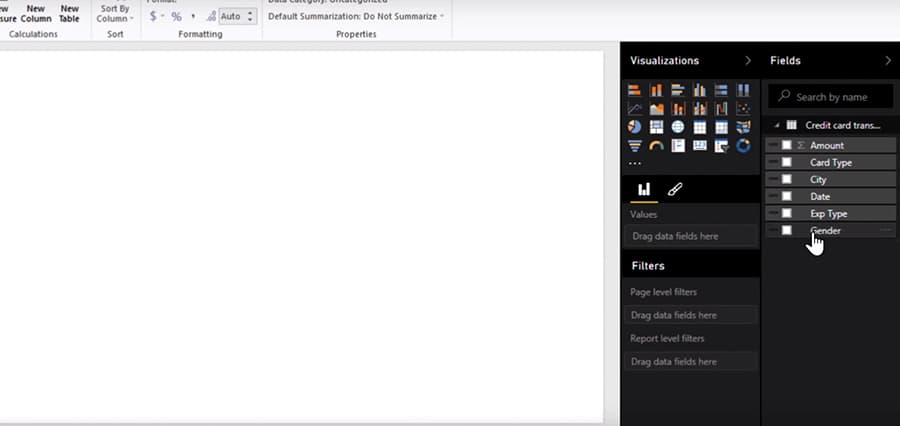
3) Report creation:
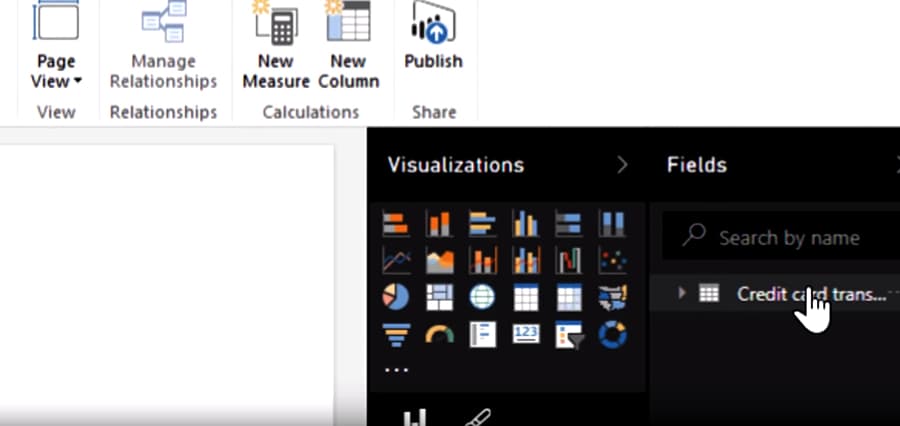
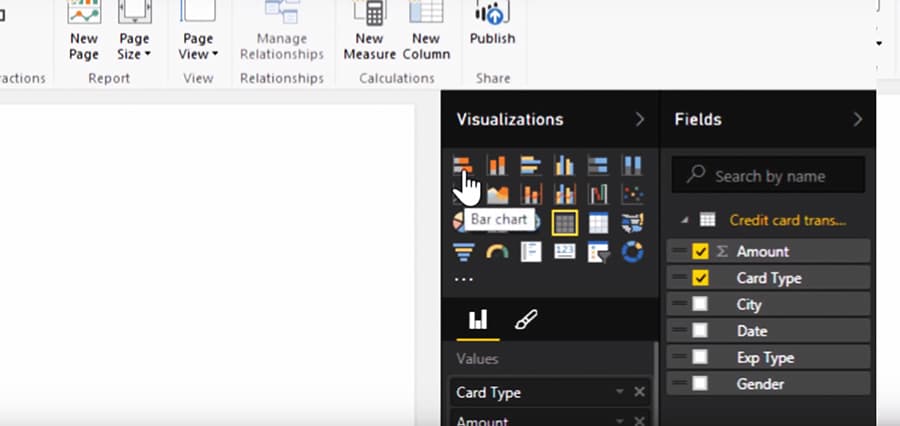
- Report creation can be done in many ways. Your data has got key elements. For example, there’s a credit card purchase list, so elements can be a city, gender, etc. For creating you need to select the respective element in fields. Then select which visual you want in the Visualizations. Overall just select the element & visualization. Visuals will be added automatically.
- The default visualization is Table, you can change it to other visuals according to your wish. You can drag and drop any element to summarize different visuals on one page. Coming to Data Label, you can summarize statistical figures into thousands, hundreds, or even exact figure. For doing so, you just need to go to Data Label on the Right side & make changes on the Display.
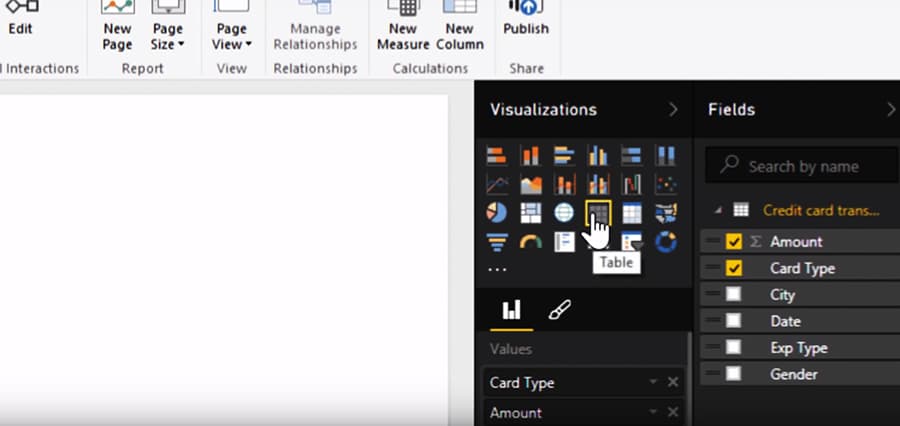
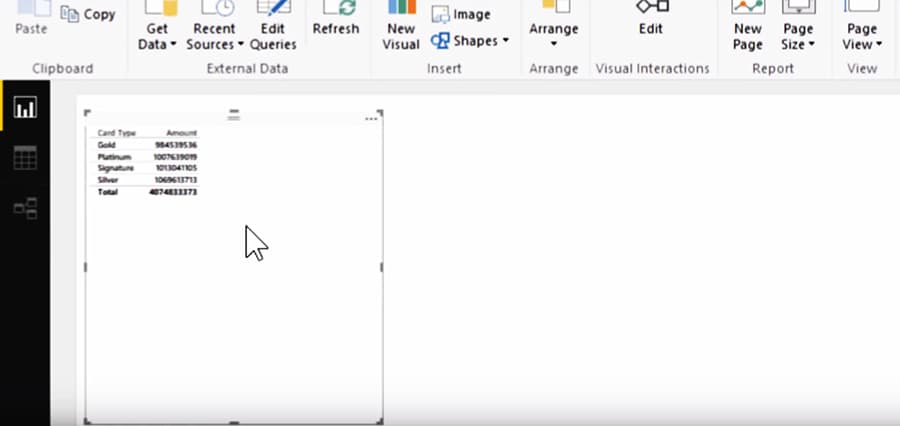
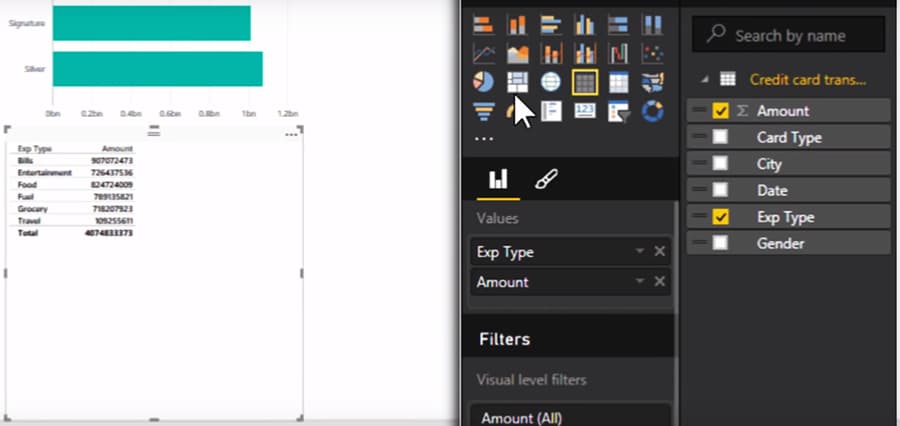
- Below visualization option, there are 2 options, Fields & Format. You can calculate things related to your dataset using Power BI. You just need to make changes in Fields that is below Visualizations option. In fields go to Values. For example, we have data where the card amount is shown with the different card types. We need to calculate the total money paid of all card types. So, we will select payment element in Fields, go to fields & select Sum.
4) Customize Report:
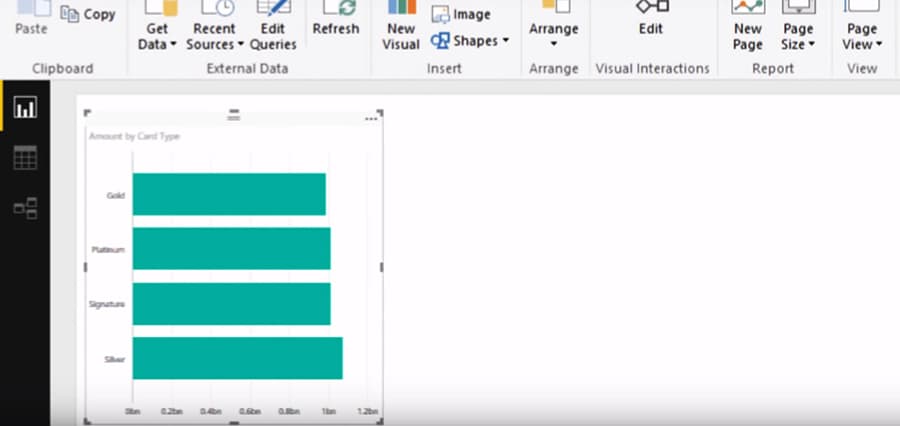
So now you want to be presented the above report in a bar chart way. So just click the Bar Chart icon as shown below and you have a bar chart of the relevant data.
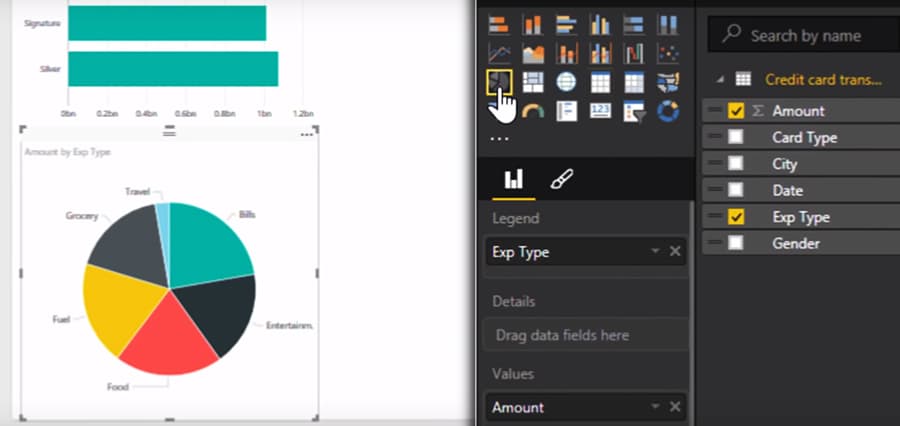
Similarly, you can add a pie chart below or any visualization of your choice.
- You can also plot maps along with the reports. Parameter/elements with location figure are represented on a map. Power BI plots locations on the map.
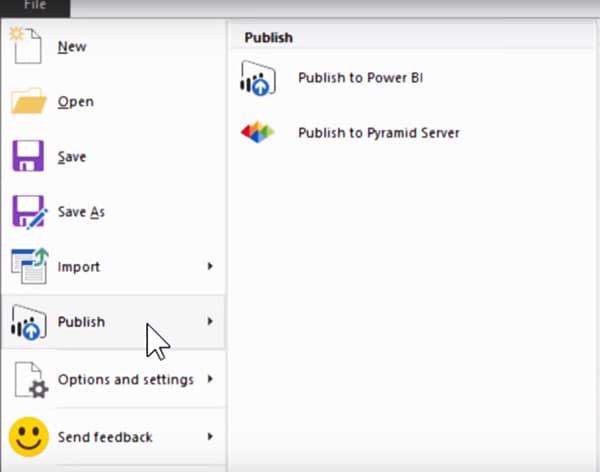
5) Publish:
- Now when you got the feel of how things work, you can publish it. Also, you can save your work on PC before publishing. Just go to File > Save > Locate a perfect place > Name the file > OK. The file will be saved with a .pbix extension.
- Go to File which will be on the upper left > Publish > Publish to Power BI > Success!
- Once the data is published, you will get a link that you can share with your colleagues. Click on it to see the preview.
6) Power BI Dashboard & Report:
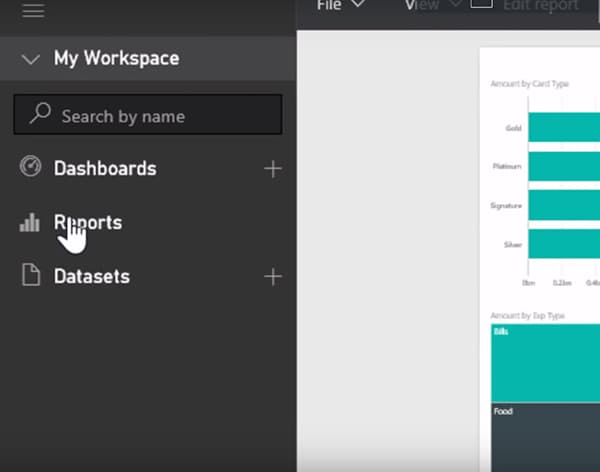
- When you open your work on Power BI, you will find 3 options, Dashboard, Reports & Datasets. So you can see that your work file is saved in Reports & Dataset. You can interact with it easily. Now, if you want to share this report, you need to create a dashboard. Because reports cannot be shared. To make the dashboard we need to use “PIN”.

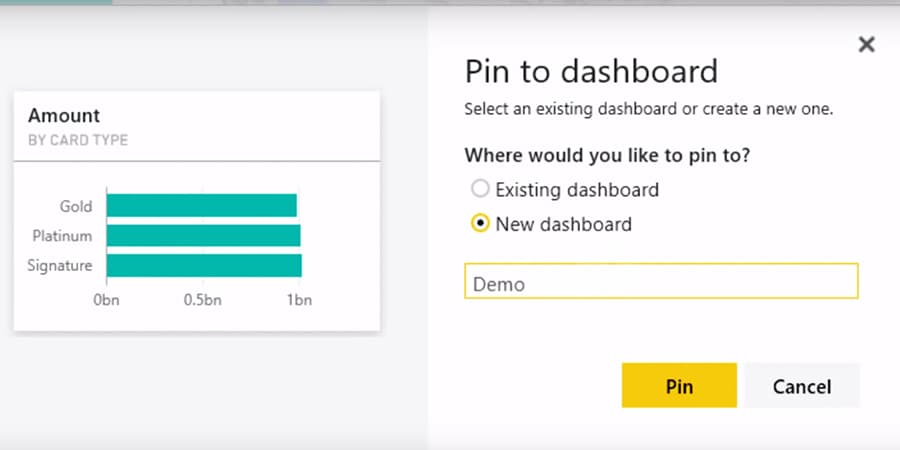
- Every visual on the report has got a Pin visual option on the upper right. Just click on the Pin visual option. The dashboard will ask what you want to do. Being this visual a part of a new file, you will select New dashboard. Name it (Let’s say Demo) & Pin it!
- After pinning 1 visual, we will select the existing dashboard > Demo. Now, you can pin all visuals to the dashboard. Once the visuals are pinned, go to Dashboard > Demo. You will find the visuals of report present here.
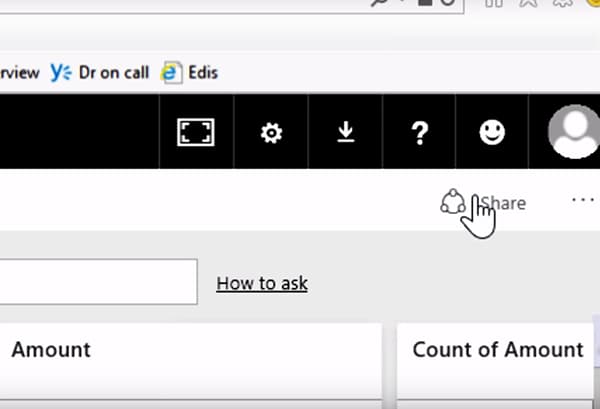
7) Share Dashboard:
- The dashboard can be now be shared, just go to Share on the upper right side. Remember, the receiver should have a Power BI account. Now we will enter the email address & Share!
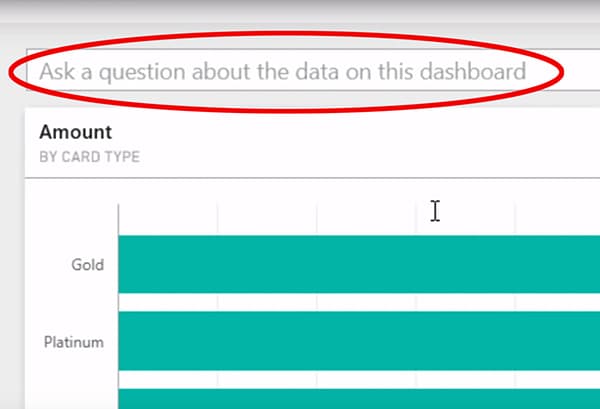
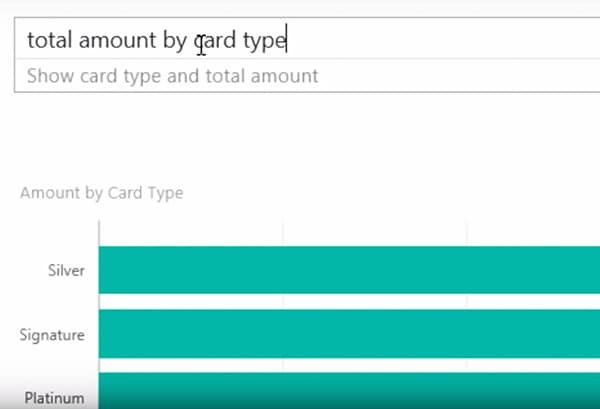
Additional Features:
There’s one impressive feature in Power BI. You can actually type any question & the visuals would appear accordingly. For example, type- total amount by card type. You will be viewed as visuals accordingly. As simple as that!
Learn more about our Power BI courses