
When it comes to business intelligence as well as data visualization, there are many players including new ones coming up day in day out. Nevertheless, the most considered tools are Power BI and Tableau. That’s because they have a great blend of brand recognition, reasonable prices and ease of use.
Microsoft Power BI And Tableau
As much as the duo are the market front-runners, the troubles don’t end there. They are almost similar hence hard to figure out the best option. That has led to the development of intense debates and discussions. For instance, we have a common one. Is Power BI better than tableau? The answer to this million dollar question remains a mystery to many people. Are you one of them? If yes, look no further. This article puts the matter to rest. Therefore, keep reading as we solve this bone of contention.
What is a Power BI?
Power BI is a data visualization software compatible with all the Microsoft applications. Despite coming into existence in 2013, it is so far one of the most preferred platforms. However, looking back, it is clear that Power BI has come a long way. That’s because the developers keep striving to ensure that the clients get the best customer experience. As a result, it is now comparable with Tableau which has been a giant since time immemorial. It uses existing systems such as Excel, SQL Office 365 as well as Azure. That combined with Revolution Analytics compatible with the R language makes it worth considering.
What is Tableau?
On the other hand, Tableau is also another data analysis tool that saw the light of the day in 2003. Until the emergence of Power BI, it dominated the desired segment. It allows the natural generation of data using reports and dashboards. The platform is not only fully integrated but also extensible. Its design facilitates security enforcement, user access management, and visualization. That would explain why it has been in the lead almost two decades down the line.
Let us take a look at a comparison of the two tools
Power BI vs. Tableau
Based on requirements, one may choose Power BI over Tableau and vice versa. However, that can only be possible if you are well-informed regarding the two. As a result of that, we will compare the duo based on many aspects. Take a look!
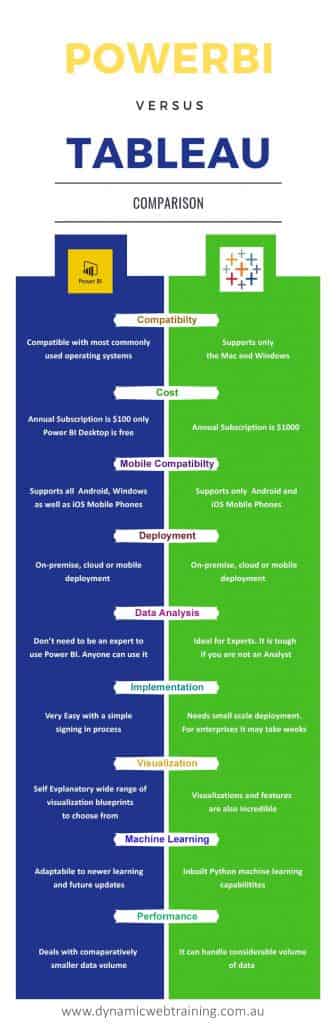
Compatibility
Power BI is compatible with most commonly used operating systems. They include Mac, Windows as well as Linux operating levels. On the other hand, Tableau supports only the Mac and Windows Operating Systems.
Cost
Money is a crucial determiner when it comes to decision making. In this case, Power BI will take the day if you are operating on a tight budget or don’t want to spend on an analytical tool. That’s because its annual subscription amounts to $100 only. Power BI Desktop is free.
On the other hand, the subscription of Tableau will cost you $1000 every year. In addition to that, Tableau incurs the owner not only upfront costs but also recurring ones. While those using the Power BI gets to enjoy free cloud-based deployment, their Tableau counterparts have to sign a contract and renew it every year.
Mobile Compatibility
When it comes to mobile compatibility, Power BI also leads. After all, it supports Android, Windows as well as iOS mobile phones. That is much more than the Tableau which is only compatible with Android and iOS mobile phones.
Deployment
As far as deployment is concerned, the duel ends as a draw. That’s because one can settle for on-premise, cloud or mobile deployment in both cases.
Data Analysis
It totally depends on the expertise of an individual. If you are not an analyst, Power BI is the best option. It has deep functionality while at the same time allows you to analyze quickly and relatively fast. As for Tableau, its extensive features make it ideal for experts. It enables them to study trends and forecast accurately.
Implementation
Power BI is also the best when it comes to ease of implementation. With a simple signing in process, you are ready to begin. That wouldn’t be said when it comes to Tableau. It has applications that help deploy them if you need small scale deployment. However, when it comes to enterprises, it would take a few weeks to implement Tableau.
Visualization
Based on the visualization approach, this is a tie unless you consider your preferences and requirements. For instance, Power BI is the most comfortable platform when it comes to uploading data sets. It has a wide range of visualization blueprints to choose from. As for the features, it has an array, and all you need is to drag and drop depending on what you want at the moment. In the same vein, Tableau is excellent if you have to deal with massive amounts data. Visualizations and features are also incredible.
Machine Learning
In this case, Tableau has inbuilt python machine learning capabilities. As a result, it will not disappoint when it comes to performing machine learning operations on your data sets. However, Power BI is an ever-evolving program. It surges ahead when it comes to future updates and adaptability to newer learning.
Performance
If you are dealing with small data, Power BI is the way to go. Tableau, however, can handle a considerable volume of data without compromising its performance. Power BI has lately started performing well with higher data volumes too.
Here are a few Power BI Features which we teach in our course at Dynamic Web Training:
Power BI Features:
- Share dashboards & reports
- Receive data, compatible on Desktop & Mobile
- Create Live, real-time data dashboards
- Data visualization with high standard graphics
- Evaluating complex data
- BI Tools for visualization & reporting
- Built and share reports via Power BI
- Import data from the computer
- Convert company data into high visuals
- Great analytical interface
- Search for visual data
- Navigation panel
- Q&A Question Box
- Help & feedback
- Office 365
Additional Special Features:
- Ad Hoc Analysis: Process built for answering specific business-related questions. This feature is used to get data from an existing report.
- Online Analytical Processing (OLAP): Quick & easy feature to access data from the existing report. Users don’t need to request data from another department, just point-and-click.
- Trend Indicators: Points patterns in a data
- Ad Hoc Reporting
- Customizable Dashboard
- API
- Activity Dashboard
- Business Intelligence
- Dashboard Creation
- Data Import/Export
- Data Visualization
- Graphical Data Presentation
- Real-Time Analytics
- Real-Time Reporting
- Reporting & Statistics
- Visual Analytics
Few of the popular companies using Power BI:
- Adobe
- HP
- Edsby
- Fordham University
- Honeywell
- Kansas State University
- Kelly Roofing
- Pepsi
- Seattle Seahawks
- Toshiba
Final Words
Given the comparison, it may be hard to get out of your dilemma. However one can tell the strength of the two tools. As far as the price factor goes, Power BI carries the day. On the other hand, Tableau offers great functionality. Assuming that your data is not too much, Power BI is the best choice. It is not only simple to use but also cost effective to implement and purchase in the first place. It ensures that you get great data analysis without having to break the bank. Equally important, you don’t have to be an expert at using it. Thanks to all that, our recommendation is the Power BI.