
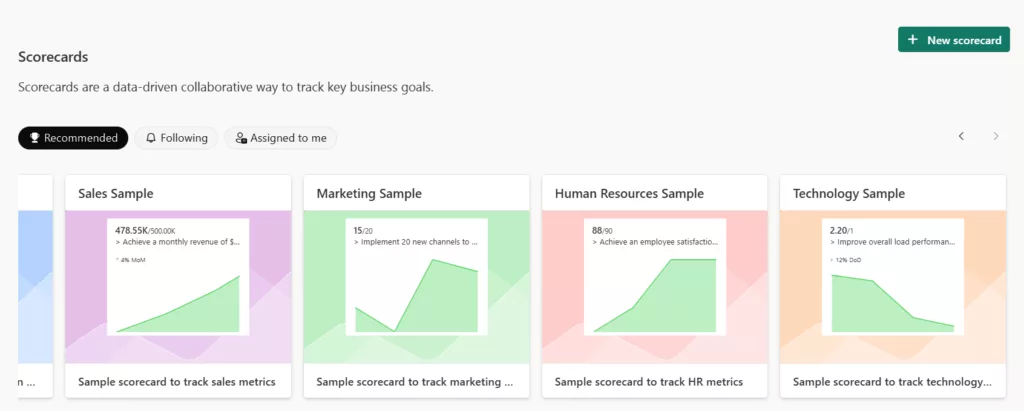
Power BI’s Goals (Metrics) feature enables data analysts to track key metrics in real-time and automate alerts when thresholds are crossed. In this blog, we will walk through creating a live, automated Power BI Goals scorecard using real-time earthquake data from the USGS.
We’ll use the USGS daily earthquake CSV feed (updated every minute), build a Power BI report with earthquake metrics, publish it with scheduled refresh, create a Goals scorecard for monitoring those metrics, and set up Teams alerts via Power Automate for proactive notifications.
By the end, you’ll see how combining real-time data with Power BI Goals and automation can provide proactive insights – allowing you to monitor critical metrics (like earthquake occurrences) in one place and get alerted as soon as something significant happens.
1. Connecting to the USGS Real-Time Earthquake Data
Our data source is the USGS “All Earthquakes, Past Day” feed, a publicly available CSV updated every minute with all earthquakes from the last 24 hours. This feed includes fields such as time of the quake, latitude, longitude, status, magnitude and more. We will import this live data into Power BI Desktop:
i. In Power BI Desktop, go to Get Data > Web. In the URL field, paste the USGS CSV link:
https://earthquake.usgs.gov/earthquakes/feed/v1.0/summary/all_day.csv
Click OK and allow Power BI to connect. It will detect the CSV format and show a preview of the data.
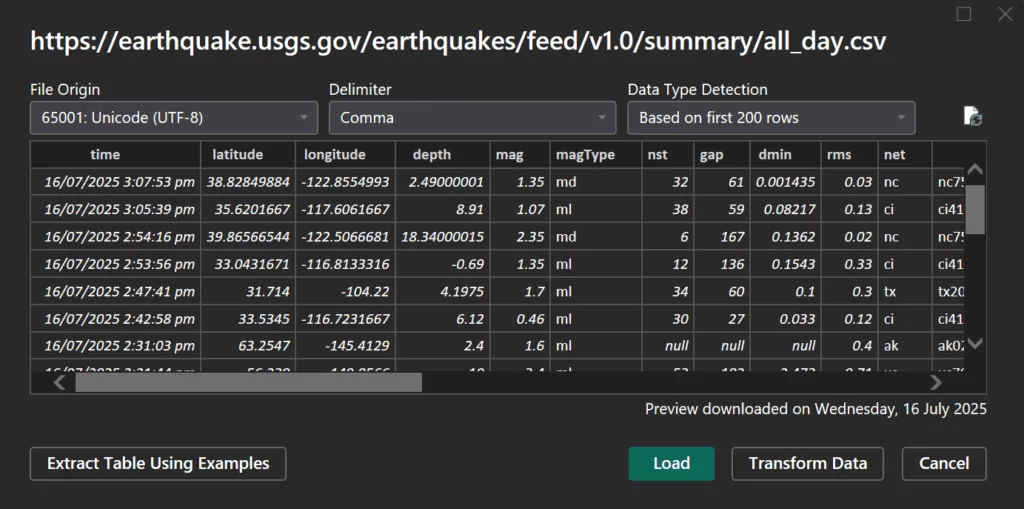
ii. Click Transform Data to open the Power Query Editor data transformations.
The feed provides a rolling 24-hour snapshot of earthquakes, so no explicit filtering by date is needed. However, you might choose to remove any fields you won’t use (to simplify the model). For our purposes, we’ll keep key fields like time, latitude, longitude, mag (magnitude), and place. Click Close & Apply to load the data into Power BI. Rename the table as Earthquakes.
At this stage, you have a live dataset of all earthquakes in the past day. Each refresh will pull the latest earthquakes reported by USGS. Next, we’ll enhance this data with some calculated columns for easier analysis.
2. Adding Calculated Columns for Magnitude Classification
To derive insights, we’ll create two DAX calculated columns in the Earthquakes table:
(i). MagnitudeBand: a categorical band for earthquake magnitude. This helps in creating charts by magnitude range.
• In the Data pane, select the Earthquakes table, click on New Column in the ribbon. Enter the DAX formula for MagnitudeBand. We use a SWITCH(TRUE()) pattern to bin the mag value into ranges:
MagnitudeBand =
SWITCH (
    TRUE (),
    'Earthquakes'[mag] >= 6, "6+",
    'Earthquakes'[mag] >= 5, "5–6",
    / else /
    "Sub‑5"
)
(ii). IsHighMag: a flag to mark high-magnitude quakes (i.e., magnitude ≥ 6.0) which we consider significant.
• Create the IsHighMag column with the following DAX formula to flag quakes of magnitude 6.0 or greater:
IsHighMag =
IF ( 'Earthquakes'[mag] >= 6, 1, 0 )
These DAX columns will enable us to easily count total quakes and high-magnitude quakes, and to break down earthquakes by magnitude range in visuals.
3. Building the Earthquake Report in Power BI Desktop
Now that our data model is ready, we can build a simple report to visualize key metrics:
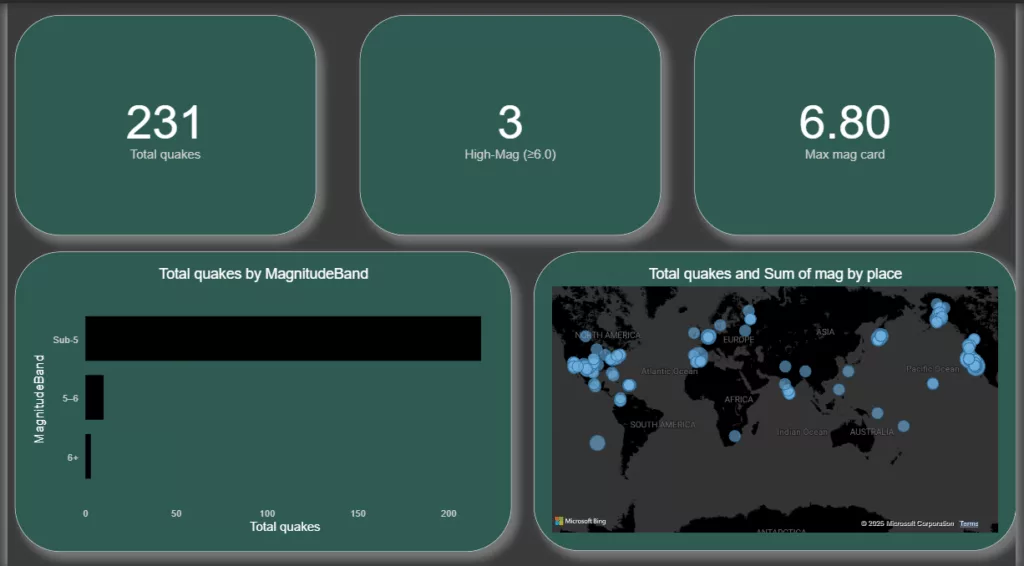
(i). A Card visual to display total number of earthquakes (in the past 24 hours).
• Click on Earthquakes tables and create a measure and use it in the card.
TotalQuakes =
COUNTROWS ( Earthquakes )
(ii). A Card visual to display count of high-magnitude (≥6.0) earthquakes.
• Create the following measure and use it in the card.
High‑Mag (≥6.0) =
SUM ( Earthquakes[IsHighMag] )
(iii). A Card visual to display the value of maximum magnitude earthquakes.
• Use this DAX for this card.
Max mag card =
MAX ( Earthquakes[mag] )
(iv). A Column chart to show the distribution of quakes by magnitude band.
• Insert a Clustered Column Chart. Set the y-axis to the MagnitudeBand column, and the x-axis to Total quakes.
(v). A Map visual to plot earthquake locations geographically.
• Add a Map visual (the basic Map). Drag place to place field well. Drag mag into Size to control bubble size. Make sure the data category of place field is set appropriately. The map will plot all earthquake locations from the last 24 hours.
With these visuals, your Power BI report provides a snapshot of the current day’s earthquake activity: total count, count of big quakes, a breakdown by severity, and a map of where they occurred.
4. Publishing to Power BI Service and Scheduling Refresh
The next step is to publish it to the Power BI Service and set up an automated refresh so that the data (and thus the goals we’ll create) stay up to date:
(i). Publish the Report: Click Publish on the Home ribbon in Power BI Desktop. Sign in to the Power BI Service. Choose a workspace. After publishing, go to the Power BI Service and verify that you see the dataset and report in your workspace.
(ii). Configure Data Source Credentials: In the Power BI Service, navigate to the dataset corresponding to your report. Click the ellipsis (…) > Settings. Open Data source credentials. Click Edit credentials. For the USGS public feed, choose Anonymous authentication and Privacy level = Public, then sign in or confirm. This grants Power BI Service access to pull the data.
(iii). Scheduled Refresh: Because the USGS feed updates every minute, you may want frequent refreshes. However, in Power BI Pro, the maximum is 8 refreshes per day. Set a schedule (e.g., every 3 hours from 00:00 to 23:00). If you have a Premium workspace or Premium Per User, you could refresh more often; but for our purposes, 8 refreshes are adequate to get near-real-time data. Ensure the time zone is correct and apply the settings.
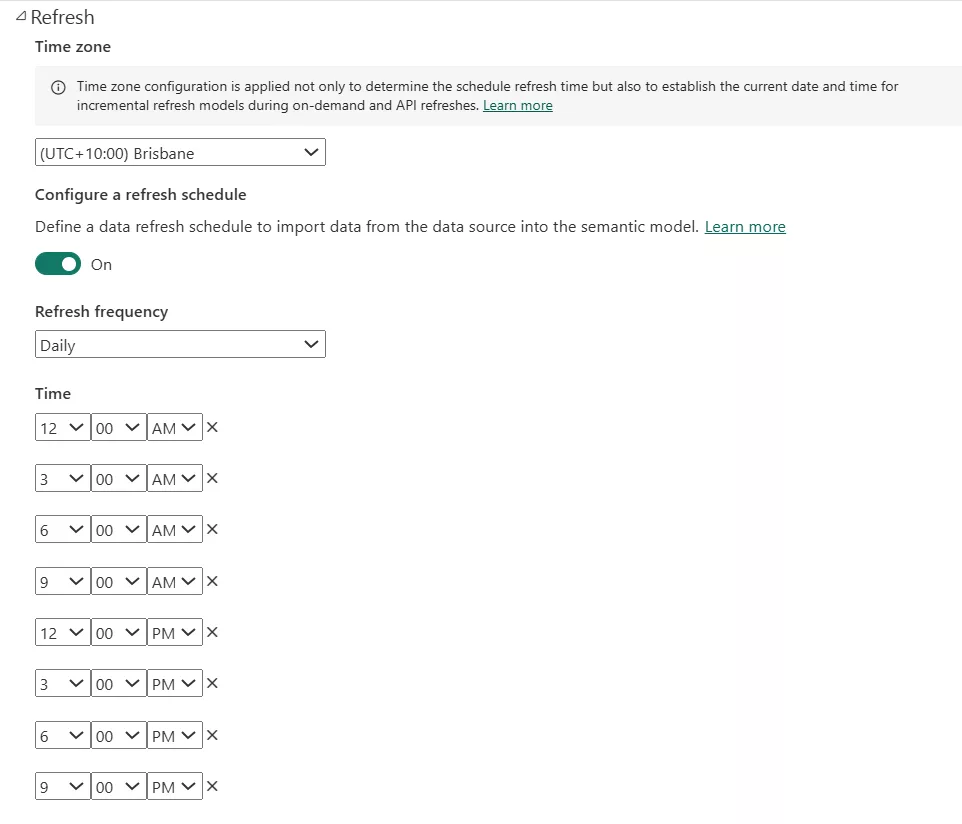
With scheduled refresh in place, the published dataset will keep updating, and by extension, any connected Goals metrics will update as well (since Goals pulls from the dataset’s latest value). Now we’re ready to create the Goals scorecard.
5. Creating a Power BI Goals Scorecard and Metrics
Microsoft’s Power BI Goals (also called Metrics in the navigation pane) allows you to create a scorecard – essentially a dashboard of KPIs – and tie each metric to data from reports. We will create a scorecard to track our earthquake metrics:
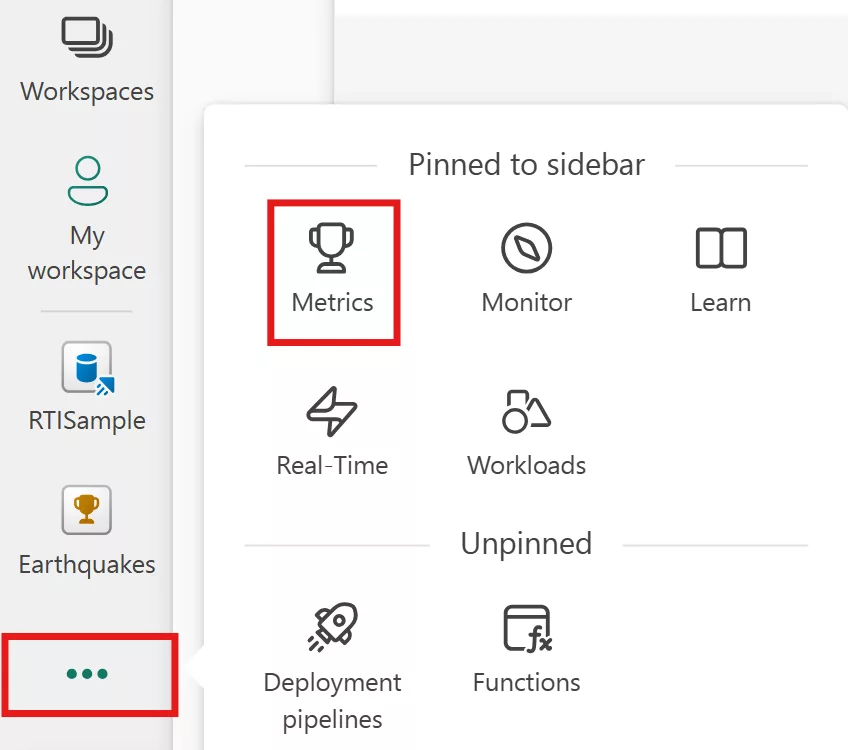
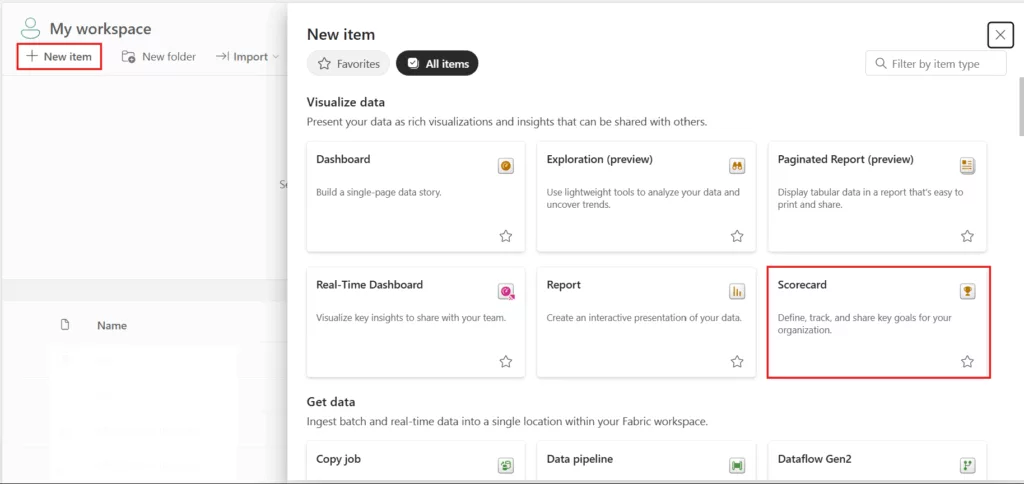
(i). Open the Metrics Hub: In Power BI Service, click on Metrics in the left navigation pane. This opens the Metrics hub. If you haven’t used Goals before, it might be empty or show sample scorecards.
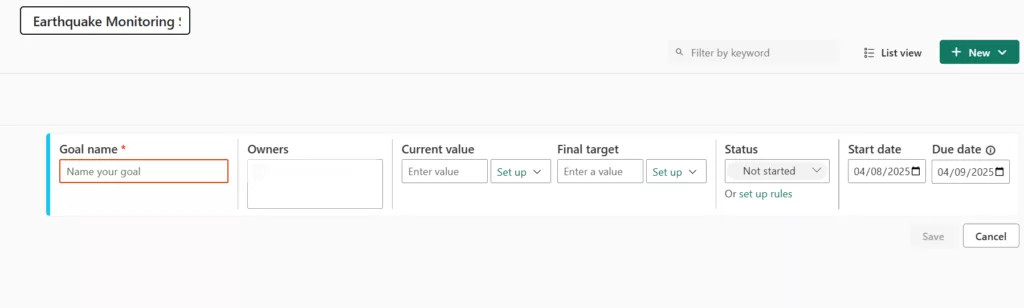
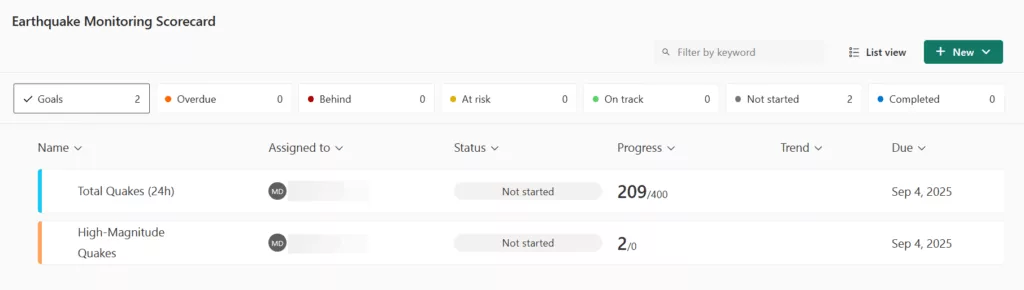
(ii). Create a New Scorecard: Click New scorecard. Name it “Earthquake Monitoring Scorecard“.
or
You may create new scorecards from your workspaces like this:
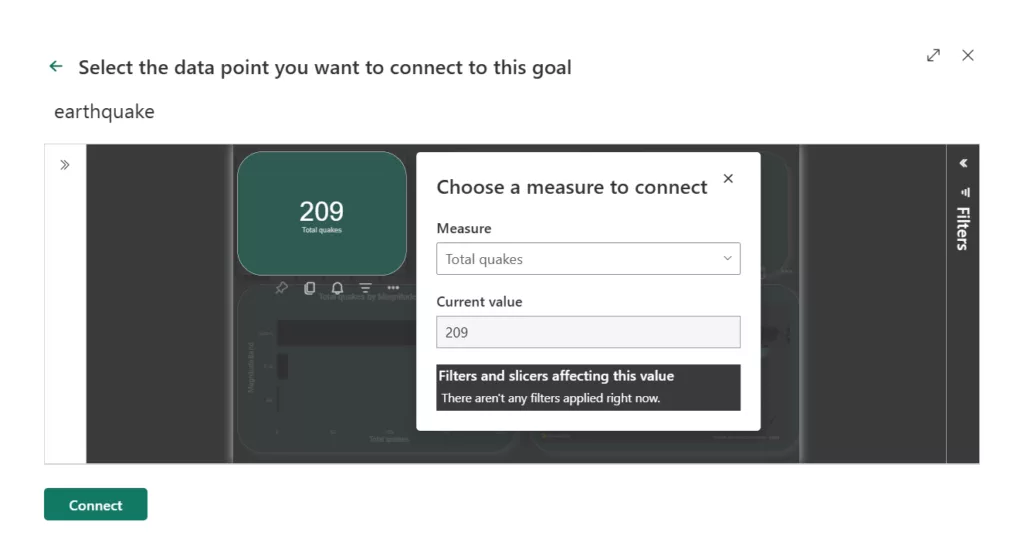
(iii). Add Metrics (Goals): On your new empty scorecard, click “New+” to add a goal/metric. For the first metric: Name it “Total Quakes (24h)“. For Current value, select Connect to data. Navigate to All reports tab and find the report you just published. Click on next. Now, click on the card visual that shows total quakes and then click on Connect (Power BI will capture the visual’s value).
For Target value, you can set a static target manually. For demonstration, let’s say we set Target = 400 quakes (just an arbitrary benchmark for “normal” daily quake count). You could also connect the target to another data point if you had one, but we’ll use a static number. Assign an Owner (could be yourself or a generic user for now) – owners receive updates and are responsible for the metric. Click on Save.
(iv). Add the second metric for “High-Magnitude Quakes“: Connect its current value to the high-magnitude quakes card visual. This is 0 on most days if no 6.0+ quake occurred, or some small number. In this case, set a Target = 0 (since ideally, we don’t want any major quakes).
6. Defining Targets and Automatic Status Rules
By default, after adding metrics, you can manually change a goal’s status or set up rules. We want automated status updates:
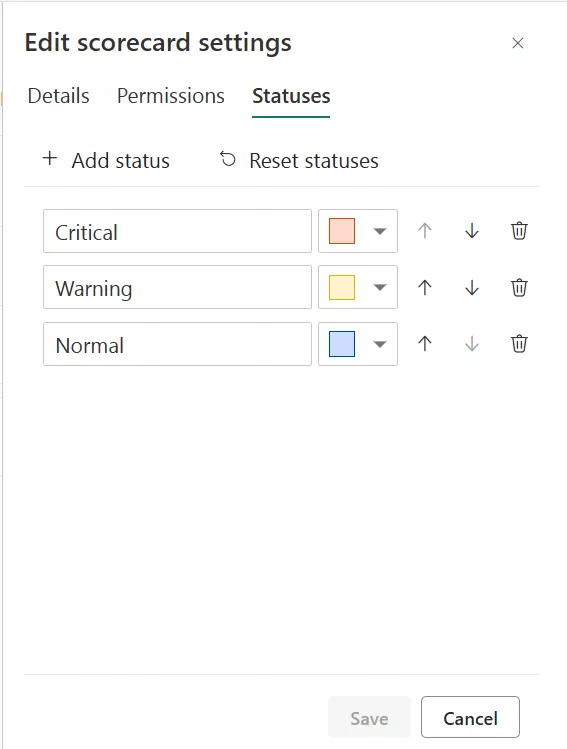
(i). Edit Status Rules: Enter Edit mode on the scorecard (there’s an Edit button or Read mode toggle on the scorecard page).

In Edit mode go to settings and set your scorecards rules as shown and save them:
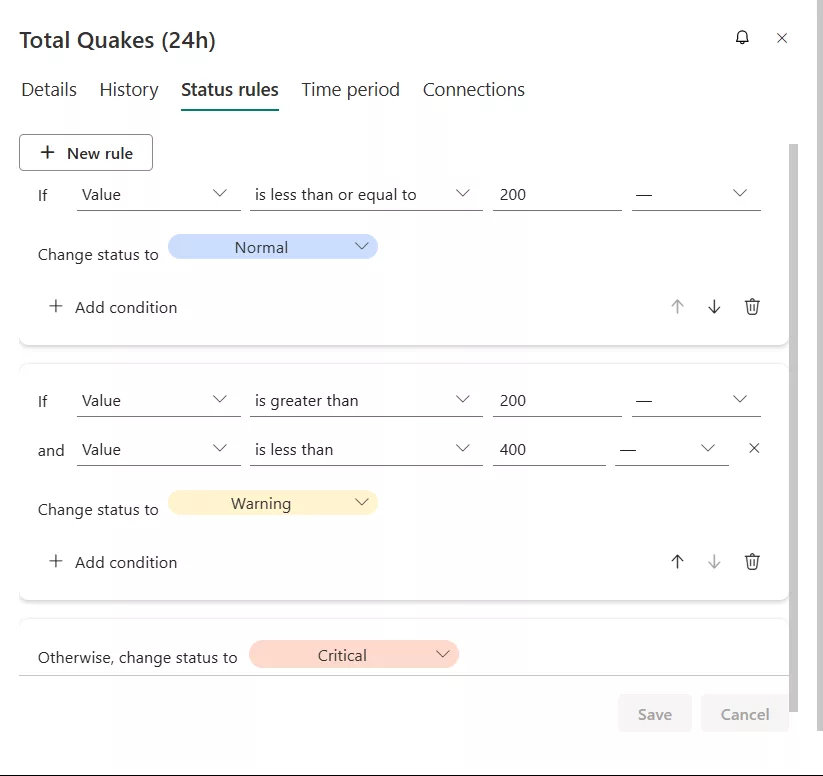
(ii). For the Total Quakes (24h) metric, click the “edit this goal” next to it and choose “set up rules” under status section. This opens a pane for status rules.
If Current value > Target (meaning more quakes than our threshold), then status = Critical (indicating higher than usual activity).
(iii). Similarly, Add Rule for High-Magnitude Quakes. If Current value > 0 (i.e., one or more high magnitude quakes occurred), then status = Critical. If value = 0, status = Normal (all clear). Save the rule.
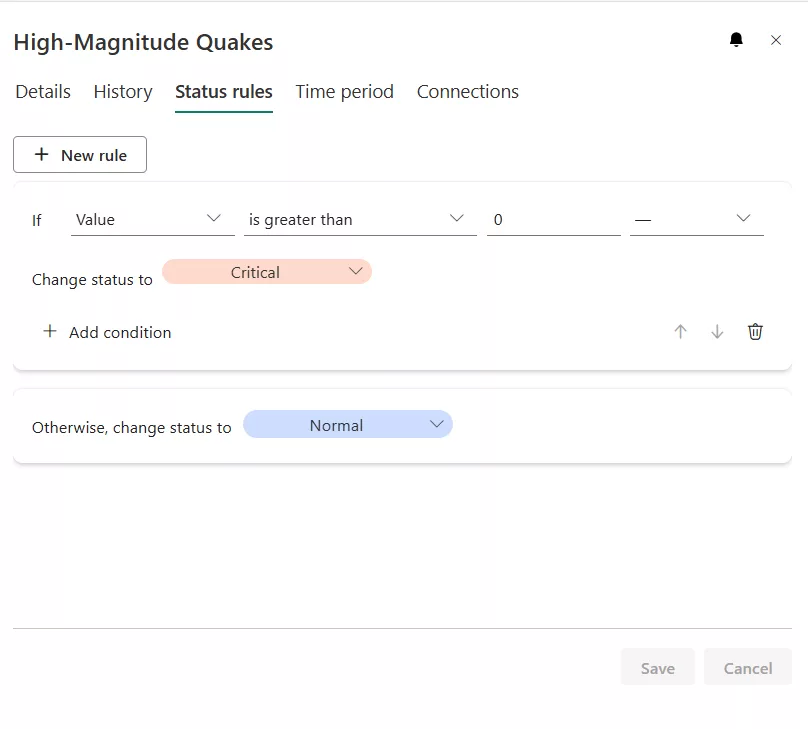
Power BI Goals’ status rules are quite flexible – you can base them on the numeric value, percent of target achieved, or even date. In our case, simple value comparisons suffice. These rules will now automatically update the colour of the metric whenever the data refreshes and the condition is met.
7. Enabling Trendlines and Historical Snapshots
One powerful aspect of Power BI Goals is the ability to see trends over time for each metric. When metrics are connected to data and regularly refreshed, Power BI captures snapshots of the value on a daily cadence by default. These snapshots allow Goals to display a sparkline (trendline) for the metric and to maintain a history of how the metric has changed.
To ensure you’re capturing history:
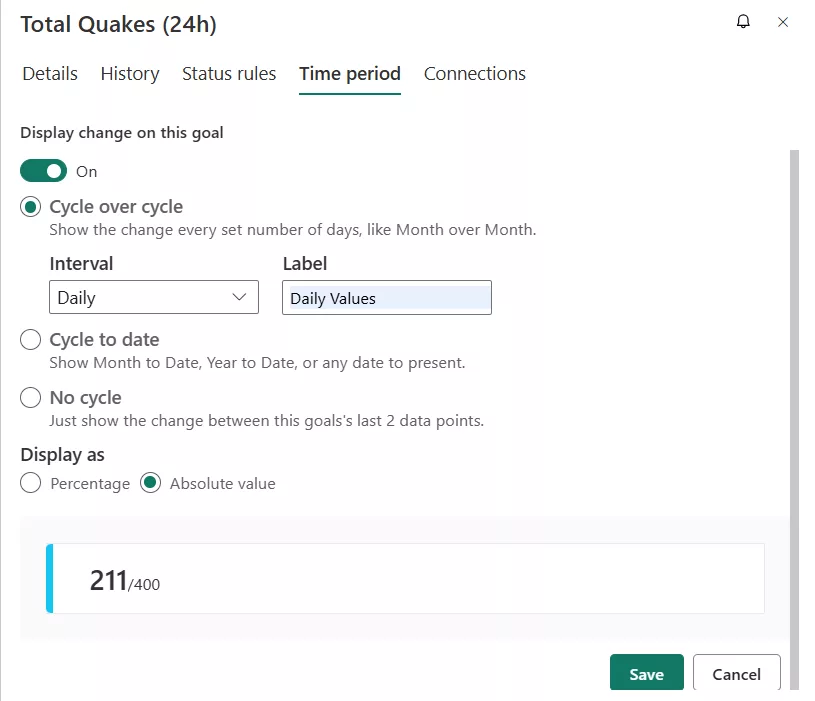
(i). In our case, our metrics are rolling 24h count, which resets daily. Power BI will take one snapshot per day of the current value. To set up the trendlines, open the “time period” tab and choose cycle over cycle radio button. Set interval as daily and labels them as Daily Values. Display the values ad absolute values. Save the changes. And do these steps for the other metric as well.
Over a few days of operation, you will start seeing a trendline on the scorecard under the trend column, indicating how the value changes each day. For example, Total Quakes might fluctuate each day (perhaps one day 230 quakes, next day 270, etc.).
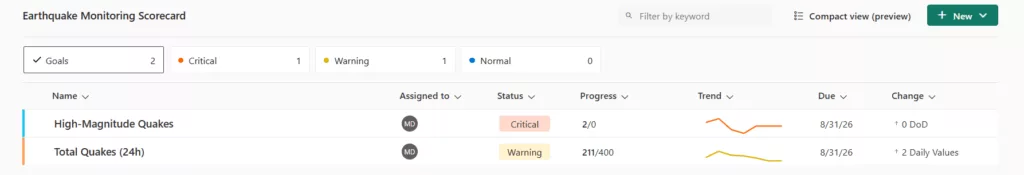
The trendline will plot those daily values so you can visually spot upward or downward trends. This is particularly useful for seeing whether the metric is consistently rising, seasonal patterns, or the impact of events. In our scenario, it could highlight if seismic activity is increasing over days. This is incredibly useful for proactive analysis – e.g., if the trend shows a steady rise in daily quakes, you might anticipate an “at risk” status soon and investigate why the activity is increasing.
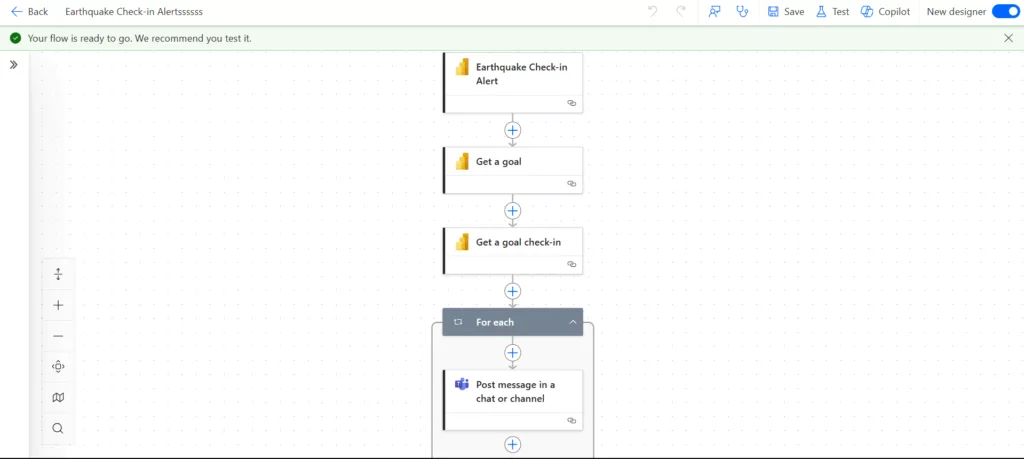
8. Automating Teams Alerts with Power Automate
Having a live scorecard is great, but we can take it a step further: automated alerts. We want Power BI to proactively notify us (or our team) when check-ins are made. This flow setup sends notifications whenever a check-in is logged for a goal — ideal for data analysts, team leads, or operations heads who need timely updates. Power BI integrates with Power Automate to enable such notifications. Here’s how to set up a Teams alert via a Power Automate flow:
(i). Copy your Scorecard: Power Automate only supports shared or collaborative workspaces, not “My workspace” so if your scorecard is in “My workspace” then move your scorecard to a shared Workspace. In Power BI Service: Go to the Scorecard inside “My workspace”. Click File → Copy. Save it into a shared workspace (e.g., one you or your team owns).
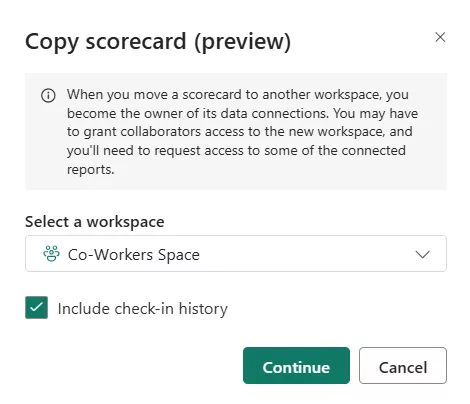
Mark “include check-in history” check.
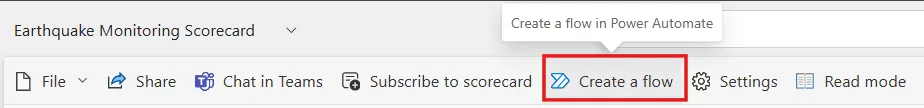
(ii). Create a New Flow: Go to Power Automate and sign in. Or click on “Create a flow” from the top action bar.
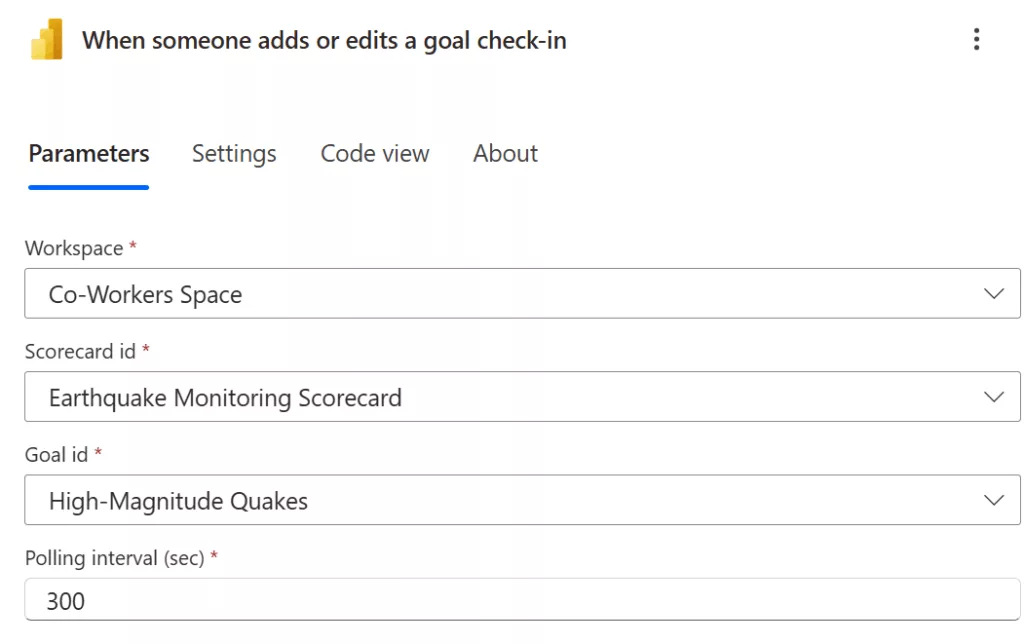
(iii). Choose Trigger: Select the trigger “When someone adds or edits a goal check-in “. This trigger will fire every time someone logs a check-in manually or via automation.
You’ll need to configure:
- Workspace → your report workspace
- Scorecard → your scorecard name
- Goal → the target goal (e.g. “High-Magnitude Quakes”)
- Polling Interval → This means Power Automate will check after the given interval for a check-in change. You should change it to the minimum of 300 seconds for near-real-time alerts.
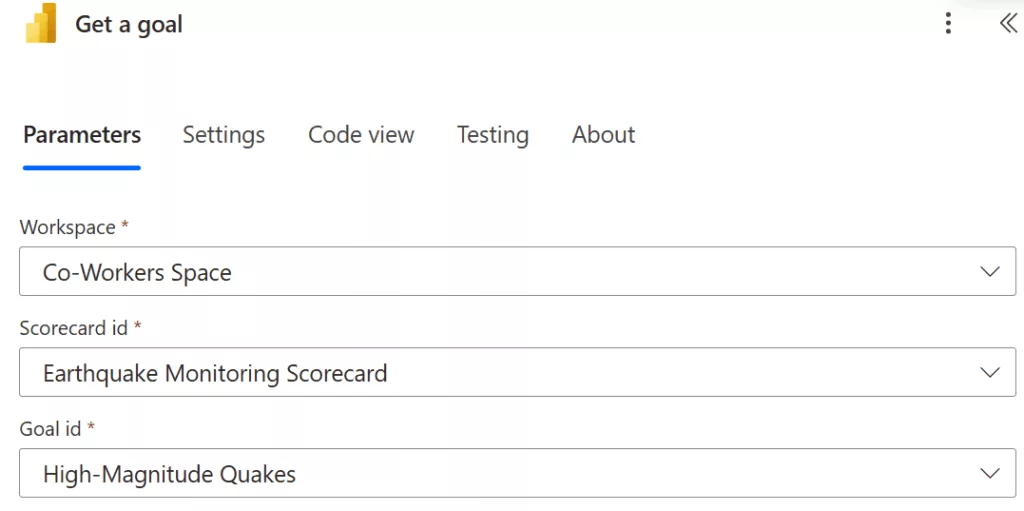
(iv). Get Goal Details: After the trigger, add a Power BI Action: Get a goal. This allows you to retrieve details about the goal/metric – such as its name, current value, target, status, owner, etc.
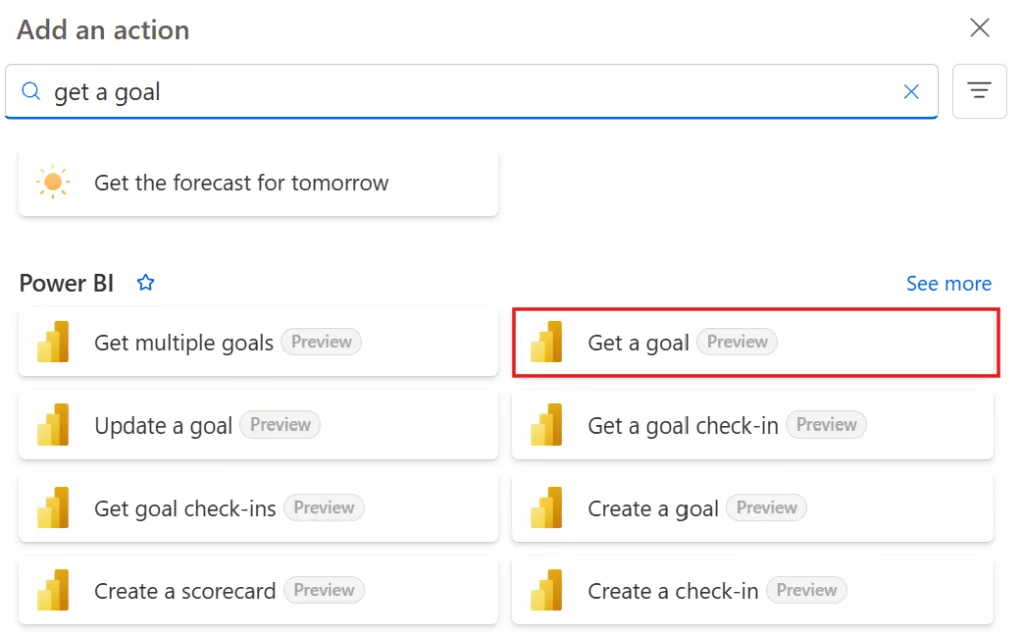
This is helpful to include dynamic information in the alert.
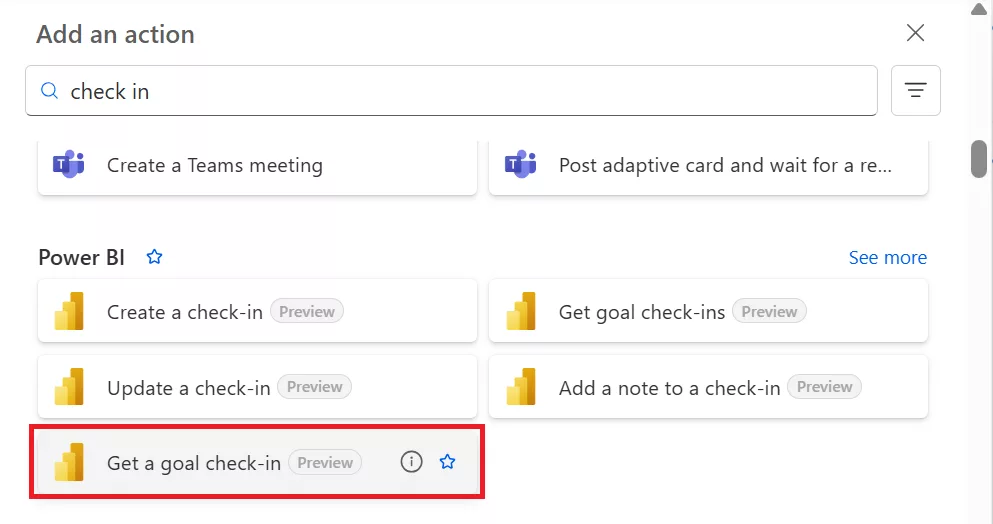
(v). Get a Goal Check-in: This grabs the exact value, note, timestamp of the check-in. Add Action: Get a goal check-in (Preview).
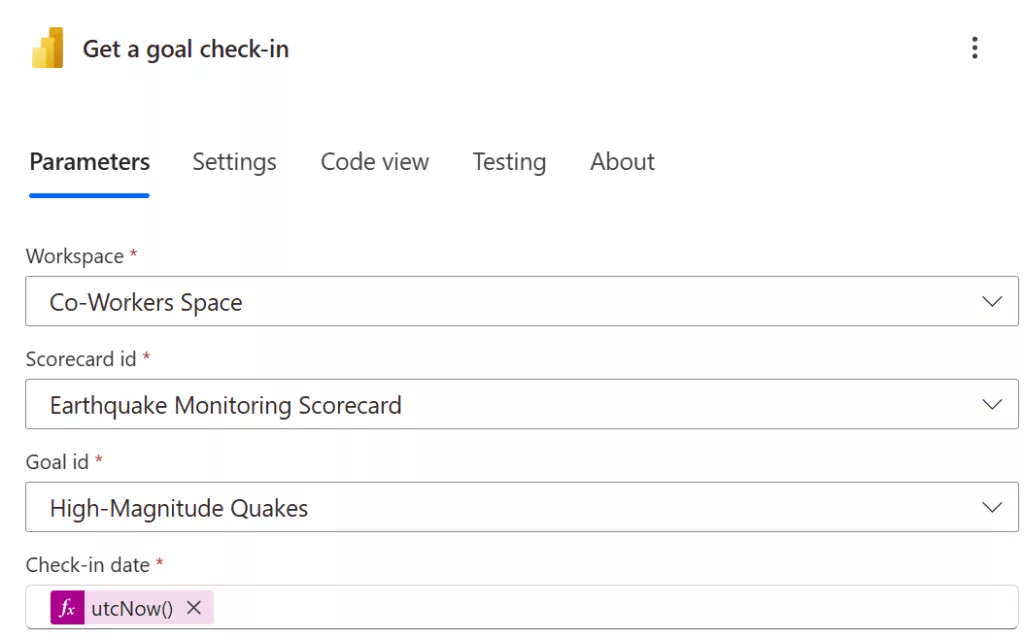
Set Check-in Date as utcNow() (expression that returns current UTC time). The utcNow() expression dynamically grabs the check-in that occurred at the time the flow was triggered.
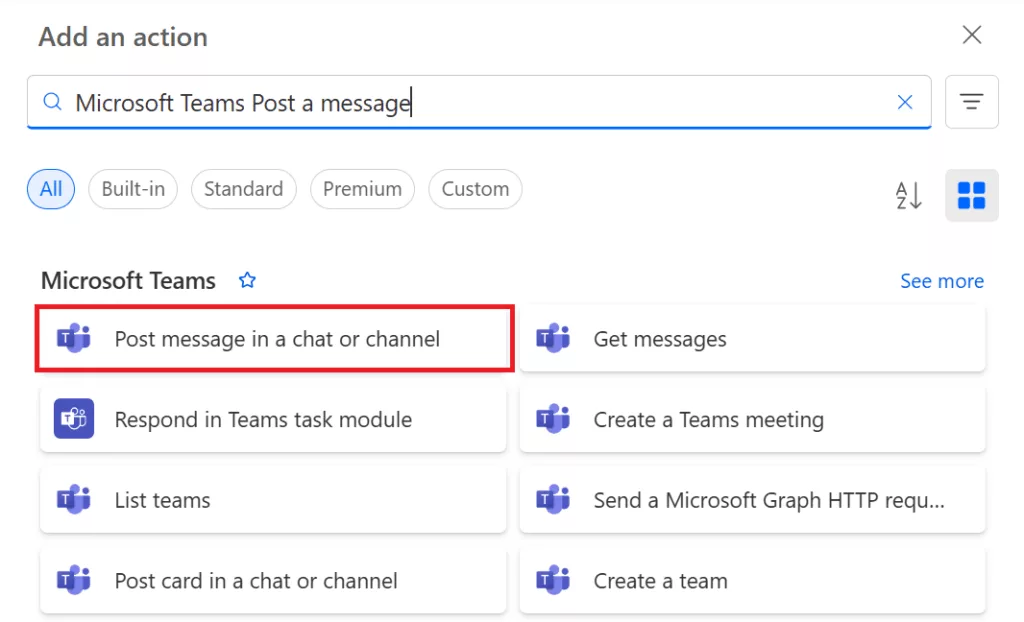
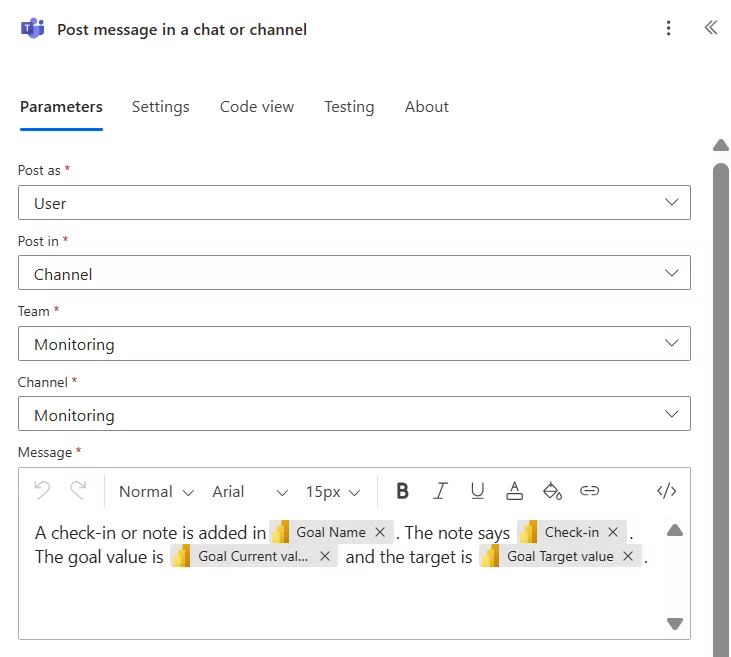
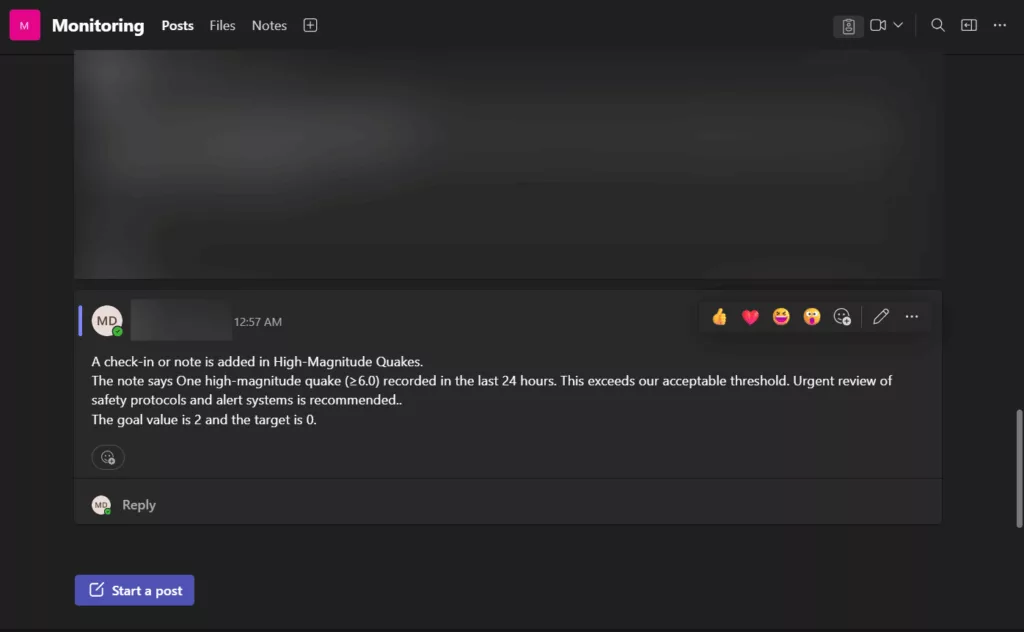
(vi). Teams Notification: Add a new step: Microsoft Teams – Post a message (you can choose to post in a channel or chat with a user).
Fill in: Team and Channel where you want the alert to appear (maybe a “Monitoring” channel). Message: Compose a message using the dynamic data. You can insert the goal name, status, current value, target from the Get a goal action’s outputs.
Message Template:
A check-in or note is added in [Goal Name].
The note says [Check-in Note].
The goal value is [Current Value] and the target is [Target Value].
Your final flow will look like this.
(vii). Test the Flow: Save the flow. To test, you can manually force the alert or change. For instance, go to the Power BI scorecard, and under the Check-in history section, click the new check-in button. In the comment box below the check-in entry, type your note:
One high-magnitude quake (≥6.0) recorded in the last 24 hours. This exceeds our acceptable threshold. Urgent review of safety protocols and alert system is recommended.
Click “Save“.
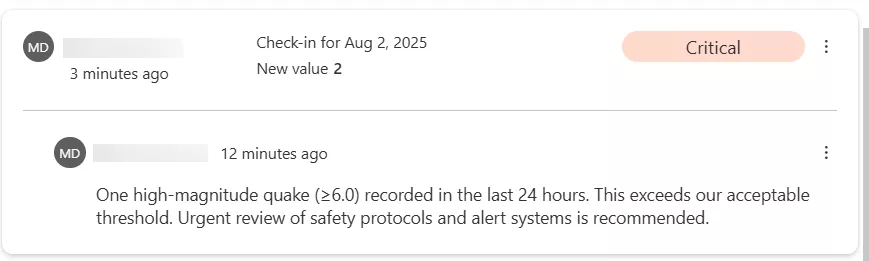
After the check-in is added, the flow will execute and show a successful run under your Automate dashboard.
(viii). Verify in Teams: You should see a Teams message in the specified Channel when the flow runs. It will contain the details you set – confirming that your proactive alert is working.
9. Conclusion: Proactive Insights with Real-Time Data and Goals
By following these steps, we demonstrated how data analysts can build a live monitoring solution with Power BI that goes beyond static dashboards. Power BI Goals transforms your reports into a dynamic scorecard for continuous KPI tracking, while automation via Power Automate ensures you are notified of important changes in real-time. The value of such a system is that it enables proactive insights – you can catch anomalies or critical events as they happen (or even anticipate them from trends) and respond quickly. To master Power BI skills refer to the range of Power BI courses we offer.