
Excel’s reputation as an analysis tool grows with each successive upgrade. While data analysis was originally confined to data in a worksheet, Excel is now being used for analysing data from a variety of sources including databases and larger corporate data sources. Whilst this can be done using Excel itself, Power Pivot is an add-in that consolidates the steps towards achieving this.
Lists, Tables, and Relational Databases
Excel, as do most other spreadsheet applications, has always provided a way of sorting, filtering, and querying data organised into rows and columns. Earlier, this type of data organisation was referred to as a list, but it is now known as a table. Once data is organised in this way you can use some of the data tools such as Pivot Tables, Pivot Charts, and Pivot View reports to drill down and analyse what is going on in the data.
However, a single table, irrespective of how many rows (records) or columns (fields) it may contain is a rather simplistic entity and doesn’t really provide much business grunt. Larger systems store data in many tables, and then relate the data in these tables to one another using a common linking field referred to as a primary key. This is what a relational database is all about – it may sound complicated but it really is just a common-sense way of organising things.
The Excel Data Model
In Excel you can model data in just this way. One way to do this would be to create a workbook where each table would be placed into a separate sheet (for convenience and ease of maintenance). You can then use the Relationships command on the Data tab on the ribbon to relate the tables together – providing they have been created with appropriate fields. In this sense a data model would be created in the worksheets of a workbook.
The problem here is that many organisations already have a system that allows users to input data. They may have an Access or SQL database system and are only really looking to Excel as a way of analysing that data. In this case it would be a waste of time to import that data into a worksheet to work on it.
Power Pivot and The Data Model
Imagine being able to use Excel’s powerful analysis tools such as PivotTables and PivotCharts on large amounts of data. Well, that’s what Power Pivot is all about.
Power Pivot provides a way of managing an Excel data model, either one that exists within the worksheets of a workbook, or one that is created from external data. Power Pivot is a separate add-in application that when installed appears as a tab on the ribbon.
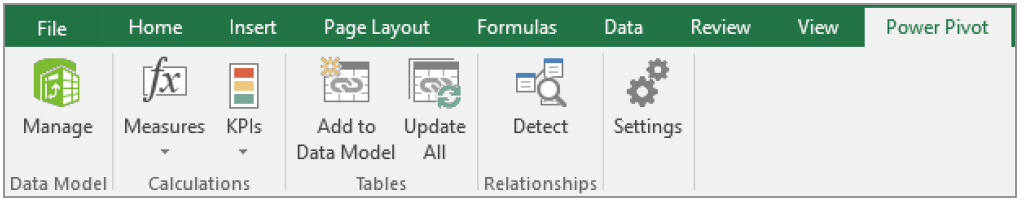
The Manage command in the Data Model group on the Power Pivot tab actually opens a window titled Power Pivot and it is here where you can get external data, filter data, create relationships between tables (if they don’t already exist) and create calculated fields. This is also where you can create Pivot Tables and Pivot Charts from the data model.
Some of the things you can do with data in Power Pivot (such as importing external data and creating relationships between tables) can be done in a worksheet. So you can work on your data model either in a worksheet or in a Power Pivot data-model window. The main difference, however, is that the Power Pivot window allows you to do much more sophisticated work with and on your data model.
By the way, the data in Excel and in the Power Pivot window is stored in an analytical database within the Excel workbook. Since the data is stored within the Excel workbook it becomes available to the analytical tools of Excel. According to Microsoft, Power Pivot supports files up to 2GB in size and will work with up to 4GB of data in memory.