
Power BI is Microsoft’s business analytics platform. It connects to your data, turns it into interactive dashboards and reports, and lets you share those insights across your organisation. If you have ever built a chart in Excel and wished it could refresh itself, pull from multiple sources, and be shared as a live dashboard, that is essentially what Power BI does, at a much larger scale.
What is Microsoft Power BI?
Power BI is a collection of tools and services that work together to turn raw, often messy data into clear, interactive reports. It connects to almost any data source, a simple spreadsheet, an SQL database, or a cloud service like Salesforce or Google Analytics, and lets you clean, model, visualise and share that data from one place.
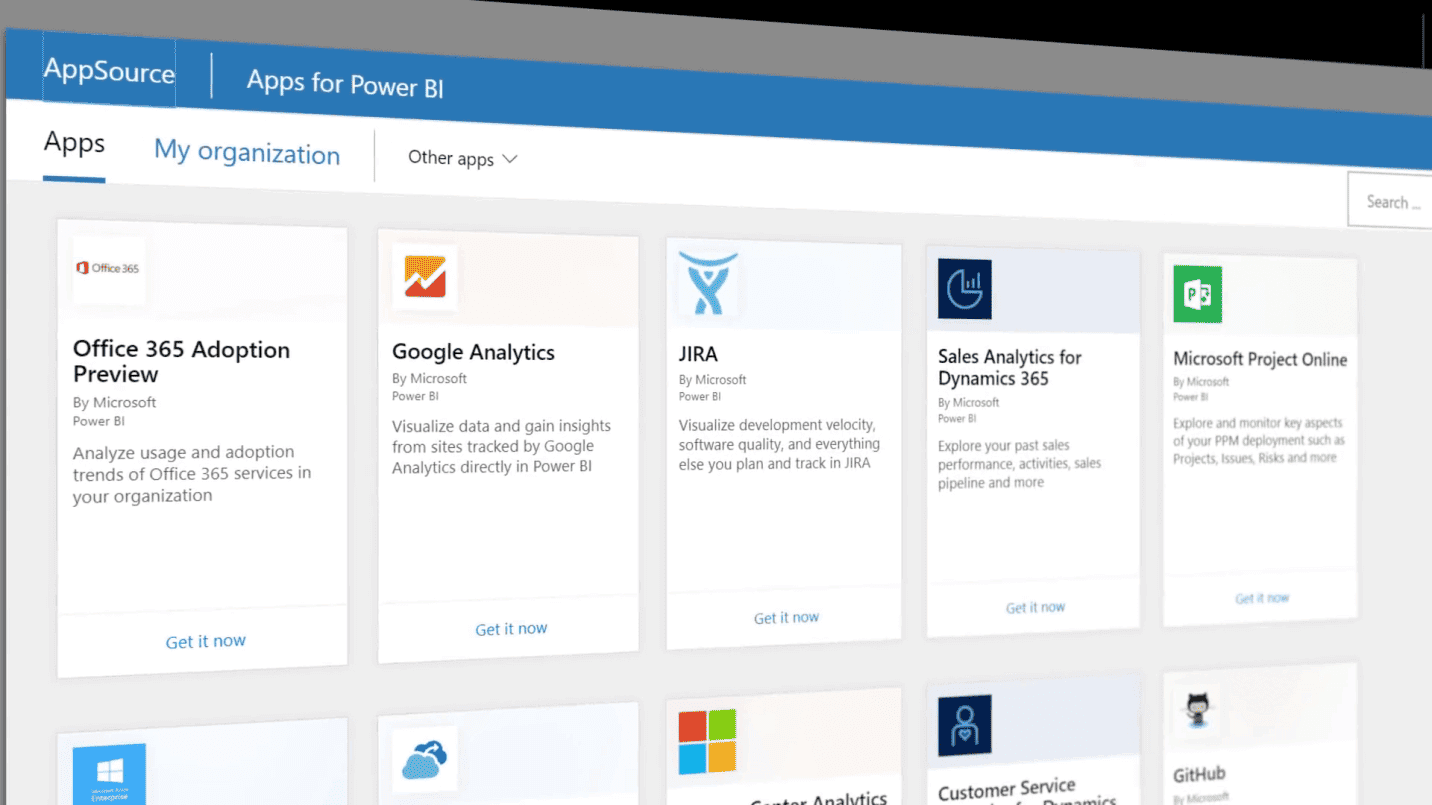
Everyone from small-business owners tracking sales to enterprise analysts building company-wide reporting uses it. In 2023, Power BI became part of Microsoft Fabric, Microsoft’s unified analytics platform, but for most users, Power BI remains the day-to-day tool for building reports and dashboards.
Why Learn Power BI?
Data visualisation and business intelligence sit near the top of the digital skills Australian employers want in 2026, which is a big part of why Power BI has become a standard workplace tool.
What can Power BI do?
Power BI covers the full journey from raw data to a shared dashboard. Its core capabilities are:
- Connect to data: built-in connectors pull data from hundreds of sources, on-premises or in the cloud, structured or scattered.
- Clean and shape it: Power Query lets you fix, filter and combine data without writing code.
- Model and calculate: you build relationships between tables and create custom metrics using DAX, Power BI’s formula language.
- Visualise: drag-and-drop to build interactive charts, maps and dashboards from a large library of visuals.
- Share and collaborate: publish reports to the Power BI Service so colleagues can view live, always-current dashboards on the web or mobile.
- Ask in plain English: Copilot and natural-language Q&A let you type a question and get a chart or answer back.
How Does Power BI Work?
Power BI follows five steps:
1. Connect to your data,
2. Transform it with Power Query,
3. Model it (relationships + DAX),
4. Visualise it as charts and dashboards, and
5. Share it via the Power BI Service, where it refreshes automatically.
Power BI Desktop vs the Power BI Service
New users are often confused by the two main parts of Power BI, so here is the simple version:
- Power BI Desktop is the free Windows application where you connect to data, build your data model, and design reports. This is where the heavy lifting happens.
- The Power BI Service is the online (cloud) side where you publish those reports, build dashboards, set automatic data refreshes, and share with others.
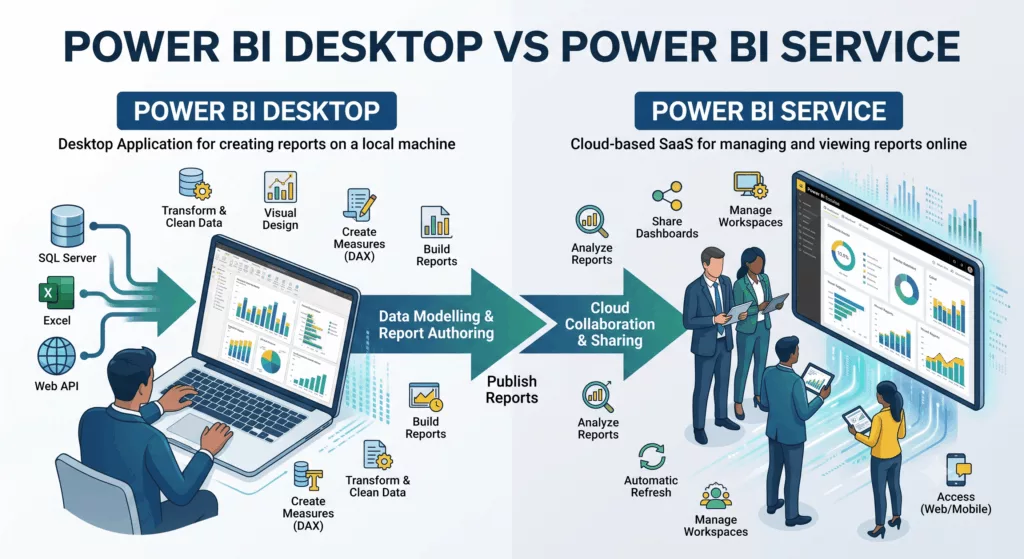
The typical workflow is: build in Desktop, publish to the Service, share with your team. There are also Power BI Mobile apps for viewing reports on the go.
What are Power Query and DAX?
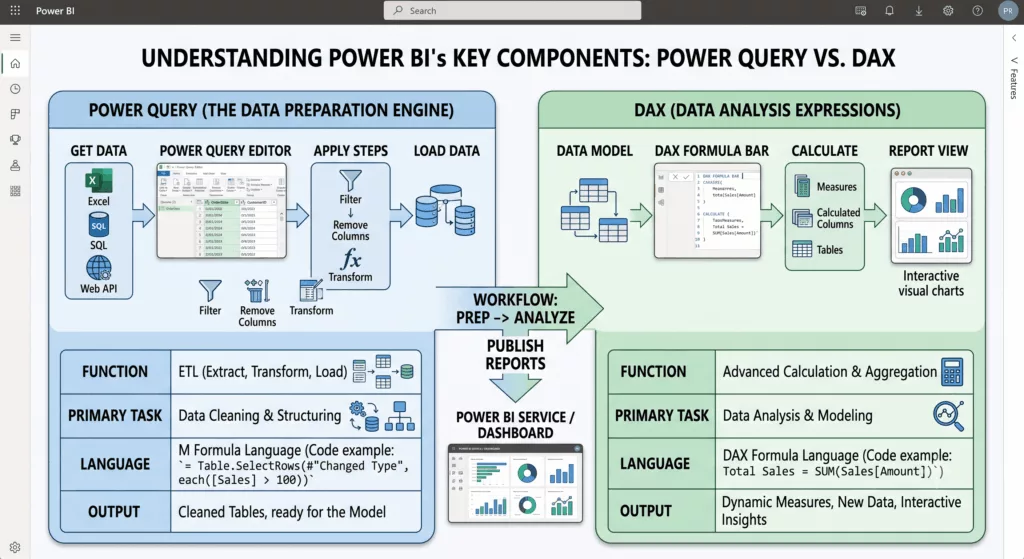
These are the two skills that separate casual users from confident ones. Power Query is the tool for cleaning and transforming data before you report on it, removing errors, splitting columns, merging tables, all through a point-and-click interface. DAX (Data Analysis Expressions) is the formula language you use to create custom calculations and measures, such as year-on-year growth or a running total. If you know Excel formulas, DAX will feel familiar, though it works on whole tables rather than individual cells.
What is Copilot in Power BI?
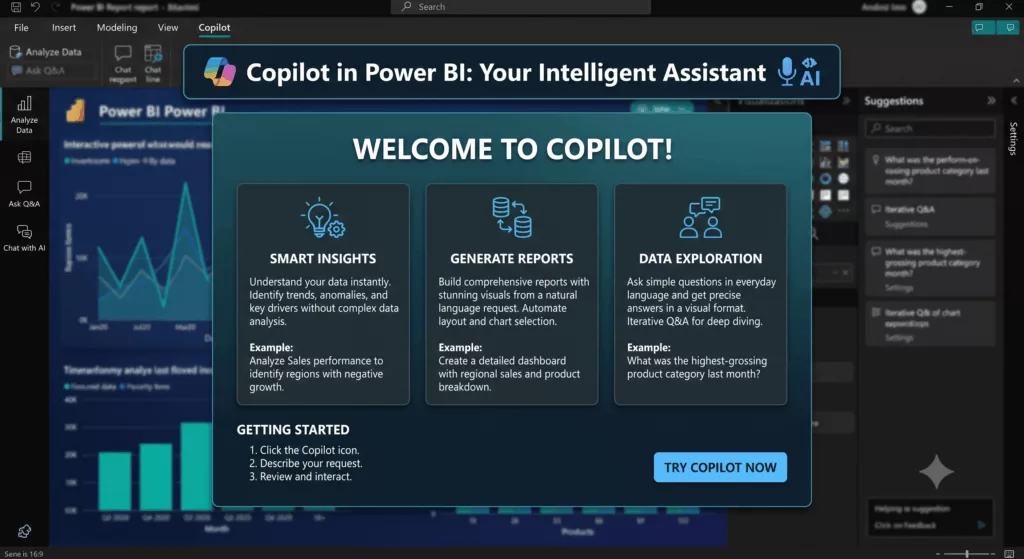
Copilot is Microsoft’s AI assistant, now built into Power BI. It lets you describe what you want in plain language and have Power BI do the work: generate a report page, write a DAX measure, or summarise what a dashboard is showing. It is one of the biggest changes since this article was first written and makes Power BI far more approachable for beginners. Access to Copilot depends on your organisation’s Power BI or Microsoft Fabric licensing.
Power BI vs Excel: what’s the difference?
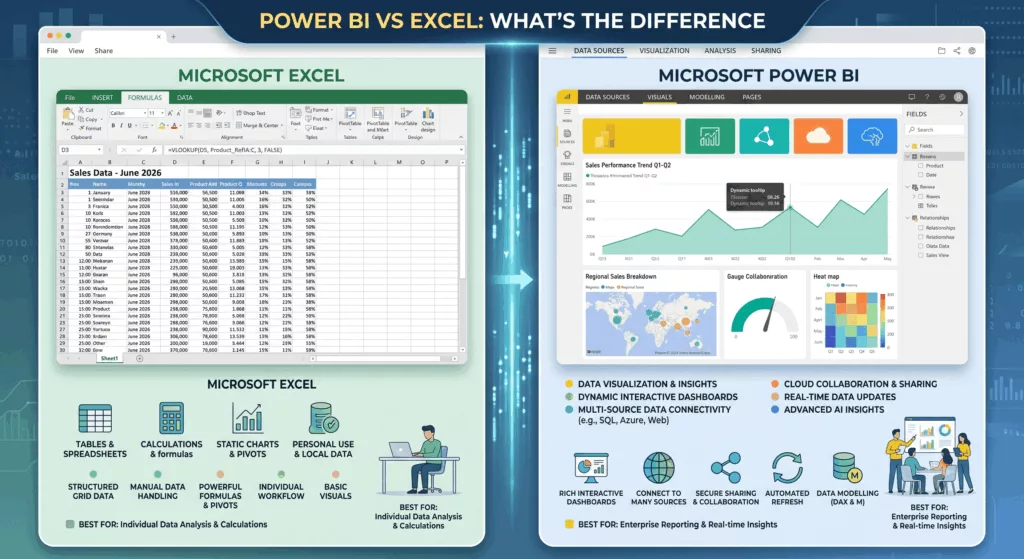
Excel is still ideal for ad-hoc analysis, one-off calculations and smaller datasets. Power BI is built to connect to large or multiple data sources, refresh automatically, and share interactive dashboards with many people. Many professionals use both: Excel for quick exploration, Power BI for reporting that needs to stay live and be shared. The good news is that the data skills overlap, so Excel users tend to pick up Power BI quickly.
How much does Power BI cost?
Power BI has a free entry point and paid tiers for sharing:
Power BI Desktop: free. You can build full reports at no cost.
Power BI Pro: around A$13.70 per user per month. Needed to publish and share reports in the Power BI Service (also included with Microsoft 365 E5).
Power BI Premium Per User (PPU): around A$34.20 per user per month. Adds larger datasets, more frequent refreshes, paginated reports and advanced features.
Microsoft Fabric capacity for larger organisations with many report consumers.
These are indicative Australian list prices (ex GST) as of mid-2026. Microsoft updates pricing periodically, so confirm the current rates on Microsoft’s official Power BI pricing page before budgeting.
How to learn Power BI
Power BI is genuinely approachable, but the fastest way to become productive is hands-on practice with guidance past the tricky parts, data modelling and DAX in particular. That is exactly how our courses are structured: you work through real reports with a certified trainer, then keep the course manual and free email support afterwards.
If you want formal recognition, Microsoft’s PL-300 (Power BI Data Analyst) is the standard certification and a sensible goal once you’re comfortable building and sharing reports.
Ready to learn Power BI properly? Explore our instructor-led Power BI training courses, available in-class in Sydney and Melbourne or Online Live across Australia. We offer five core courses in Power BI:
Power BI Essentials
Power BI Report Design
Power BI Advanced
Power BI DAX
Power BI Service
Frequently asked questions
Power BI is used to connect to data, turn it into interactive dashboards and reports, and share those insights across an organisation. Common uses include sales tracking, financial reporting, and operational dashboards.
Power BI Desktop is free to download and use. Sharing reports with others requires a paid licence such as Power BI Pro, and larger organisations may use Premium or Fabric capacity.
No. Power BI is designed to be approachable, especially for Excel users. The main learning curve is data modelling and the DAX formula language, which a structured course or hands-on practice makes much easier.
Power BI Desktop is the free Windows app where you build reports. The Power BI Service is the online platform where you publish, share, and refresh those reports for others to view.
No, but it helps. Excel skills such as working with formulas and tables transfer directly, so Excel users usually learn Power BI faster.
